7 Best JavaScript Debugging Tools You Need in 2024
According to a recent survey by StackOverflow, JavaScript is the most popular programming language, with over 62% of developers using it worldwide.
It allows developers to create interactive, dynamic web pages that improve user experience.
However, like any other language, JavaScript code is prone to bugs, which can cause a website to slow down, become unresponsive, or stop working entirely.
Finding and fixing bugs can be a major headache that wastes precious time.
That’s where JavaScript debugging tools come in.
These tools make debugging easier and ensure that your website runs smoothly.
In this guide, you’ll learn about the top JavaScript debugging tools to help you troubleshoot errors easily so you can spend more time coding.
Let’s get started.
What are JavaScript Debugging Tools?
JavaScript debugging tools are software applications that help developers find and fix issues in their JavaScript code.
These tools allow you to see what is happening behind the scenes on a website, like how data is handled or where an error occurs.
The debugging process usually includes the following steps:
- Identify the problem through error messages or user reports.
- Locate the piece of code where the bug is.
- Find out the cause of the error.
- Fix the code and test it to resolve the problem.
Many debugging tools are available for JavaScript, each with different features and purposes. Such as:
- Browser developer tools.
- Standalone debuggers.
- Linters and profilers.
- Built-in debuggers in code editors.
snappify will help you to create
stunning presentations and videos.
Why Should You Use JavaScript Debugging Tools?
JavaScript debugging tools are essential for making sure your website or application works correctly.
They help developers quickly debug and write error-free code, which makes the development process much easier and faster.
Here are some benefits of using debugging tools:
- Faster Detection of Issues: Debugging tools help you locate the exact place in your code where something went wrong so you can quickly fix issues before they become a bigger problem.
- Time and Cost Saving: Instead of guessing where the bug is, which could take hours or days to find, you can focus on writing code by troubleshooting issues faster. This saves a lot of time and cost associated with post-deployment fixes.
- Easier Problem Solving: These tools allow you to pause and inspect your code at specific breakpoints to see what’s happening step by step. This way, you can easily understand the problem and fix it.
- Improved Quality: Using debugging tools, you can write cleaner, more structured code that is easy to maintain. This means less issues and more efficient development process.
- User Satisfaction: You can make sure that everything functions as expected and provide a good experience for all users interacting with your website.
Best JavaScript Debugging Tools
Let’s look at the best debugging tools for JavaScript every developer should know.
Chrome DevTools
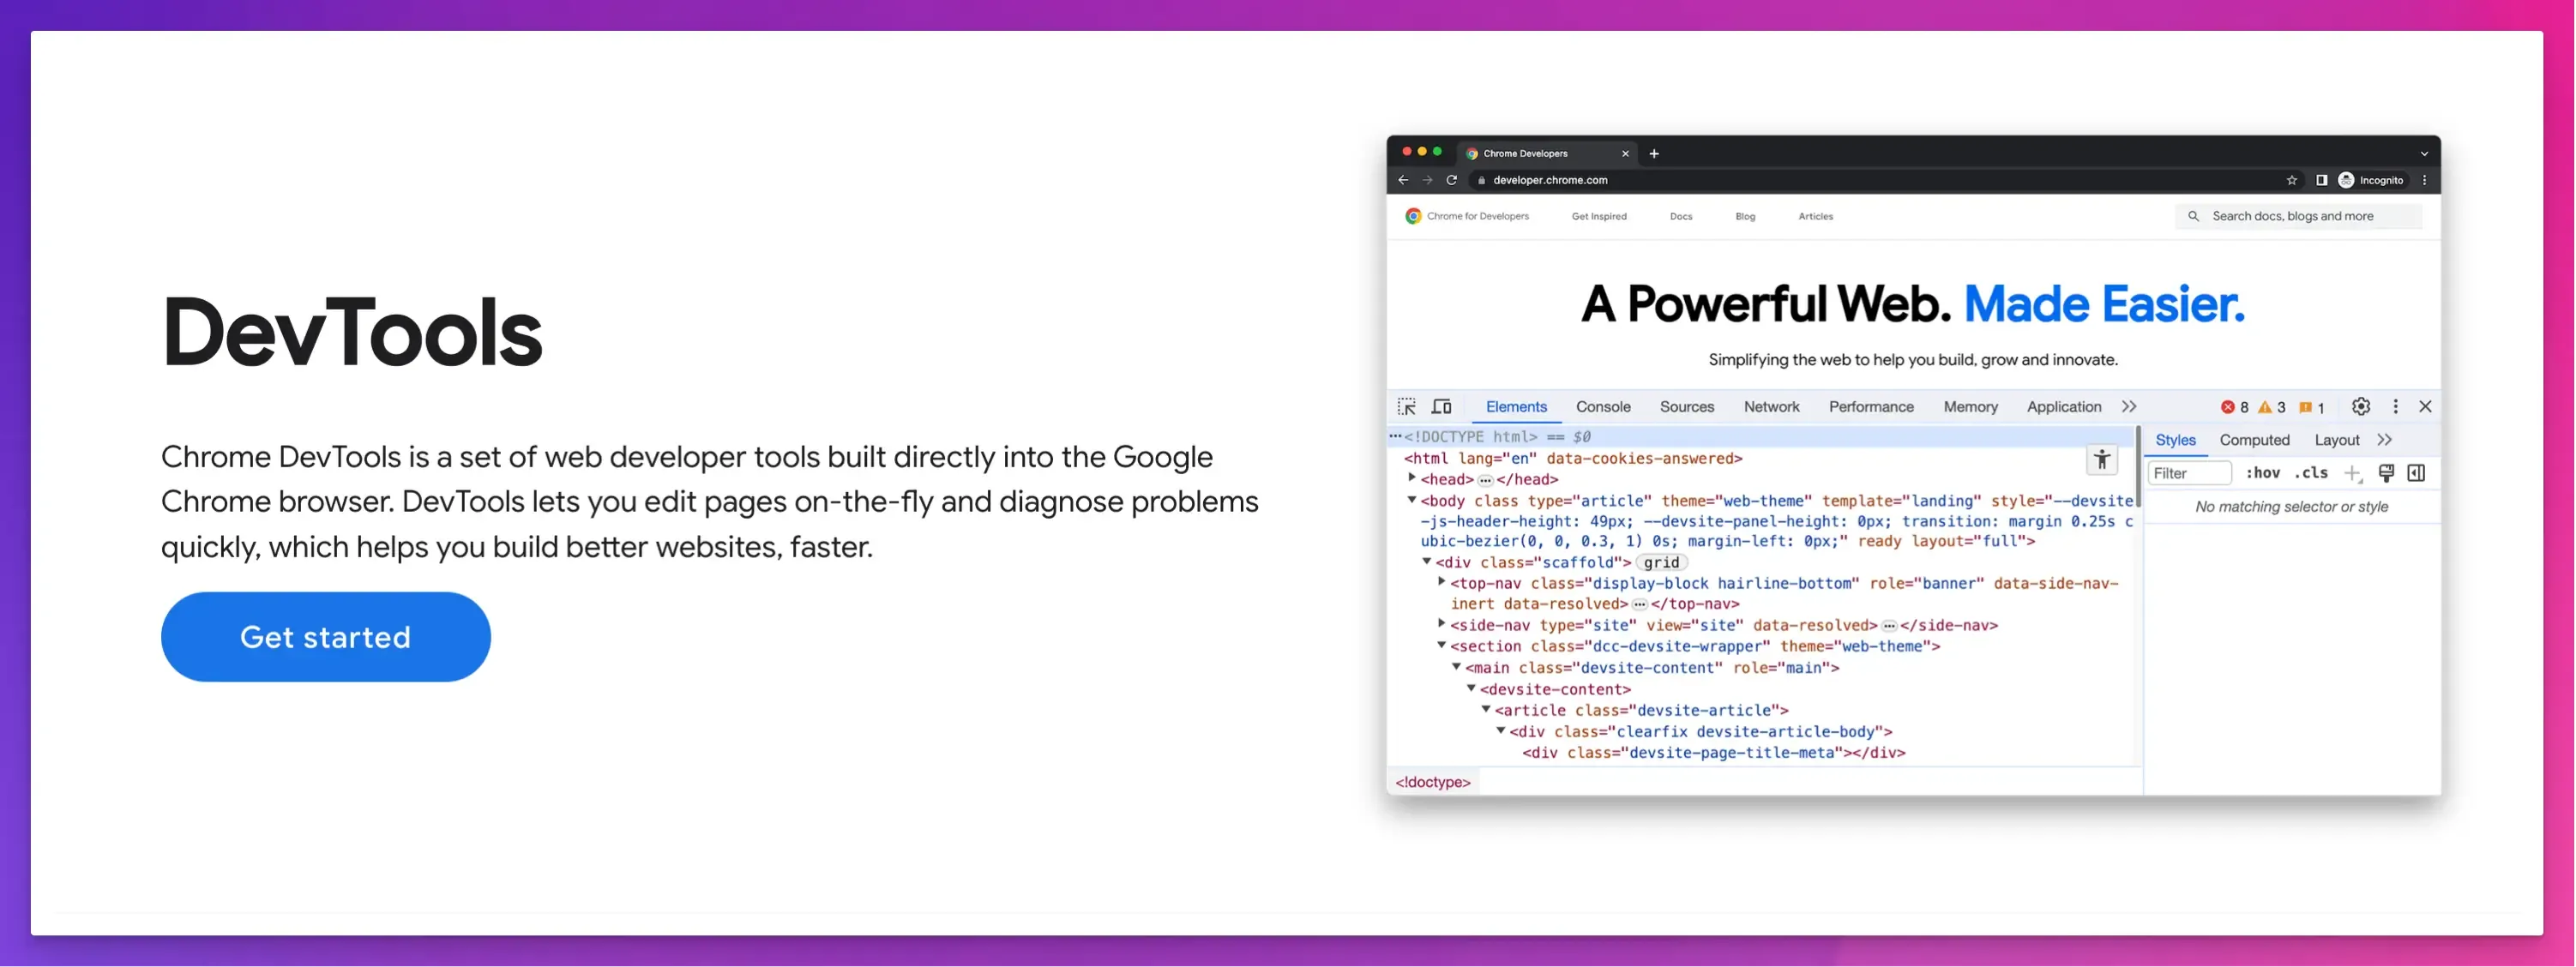
Google Chrome offers built-in dev tools that allow developers to debug code without downloading tools or extensions.
It offers various debugging features and tools for elements, network requests, performance, and security issues.
Key Features:
- You can set specific points in your JavaScript code to pause execution and go through each line of code to find errors easily.
- The console panel allows you to run JavaScript code directly in the browser, see error messages, and test code snippets.
- You can edit HTML, CSS, and JavaScript to see how changes will look in real-time without modifying the actual code.
Pros:
- Great for optimizing frontend development and debugging directly in Chrome browser.
- Real-time editing, monitoring, and performance analysis.
Cons:
- It can only be used in Chrome browser. Other browsers like Firefox, Edge, and Safari have their debugging tools.
- It can sometimes impact performance and slow down your browser.
Pricing:
It is free to use.
JSBin
JSBin is an online code editor and debugging tool for developers. It allows them to collaborate and debug HTML, CSS, and JavaScript code.
It is particularly useful for quick prototyping. You can test a small snippet of your code in an isolated environment without worrying about losing your progress.
Key Features:
- Its live reload feature offers real-time results as you code.
- You can easily share your code with other developers or troubleshoot their code.
- It supports popular JavaScript libraries like jQuery, React, and others, so you don’t have to manually include them.
- Remote rendering lets you view your output on a different device or platform.
- Custom templates, preferences and drag and drop feature to modify code as you need.
- It also provides JavaScript linting to reduce errors in your code.
Pros:
- User-friendly interface and simple setup.
- Ideal for pair programming and real-time collaboration.
- Quick debugging with immediate feedback.
Cons:
- Limited features for complex development projects.
- Requires a paid subscription for advanced features like private bins.
Pricing:
- Open-source and free.
- Paid version costs £12.99 per month.
Raygun

Raygun is a cloud-based platform that helps developers monitor errors, crashes, and performance issues.
It provides full visibility into your web application’s health across the entire stack, from frontend user experiences to backend server performance.
Key Features:
- Support for multiple languages and frameworks, including JavaScript, Angular, React, iOS, and Android.
- It offers real-time,code-level insights with detailed crash reports, including stack traces, environment, version, and more.
- Real-user monitoring to fix and improve frontend performance.
- You can use smart filters to segment errors by date, location, version, host, OS, browser, and custom tags.
- Integrations with popular tools like Jira, GitHub, Bitbucket, and GitLab.
Pros:
- Easy to use, set up, and integrate.
- Immediate alerts with bug tracking and analysis.
Cons:
- It can be expensive for small projects.
- It might create many alerts for less critical issues, making focusing on more important ones harder.
Pricing:
- Free trial available.
- Pricing starts from $40 per month.
Sentry
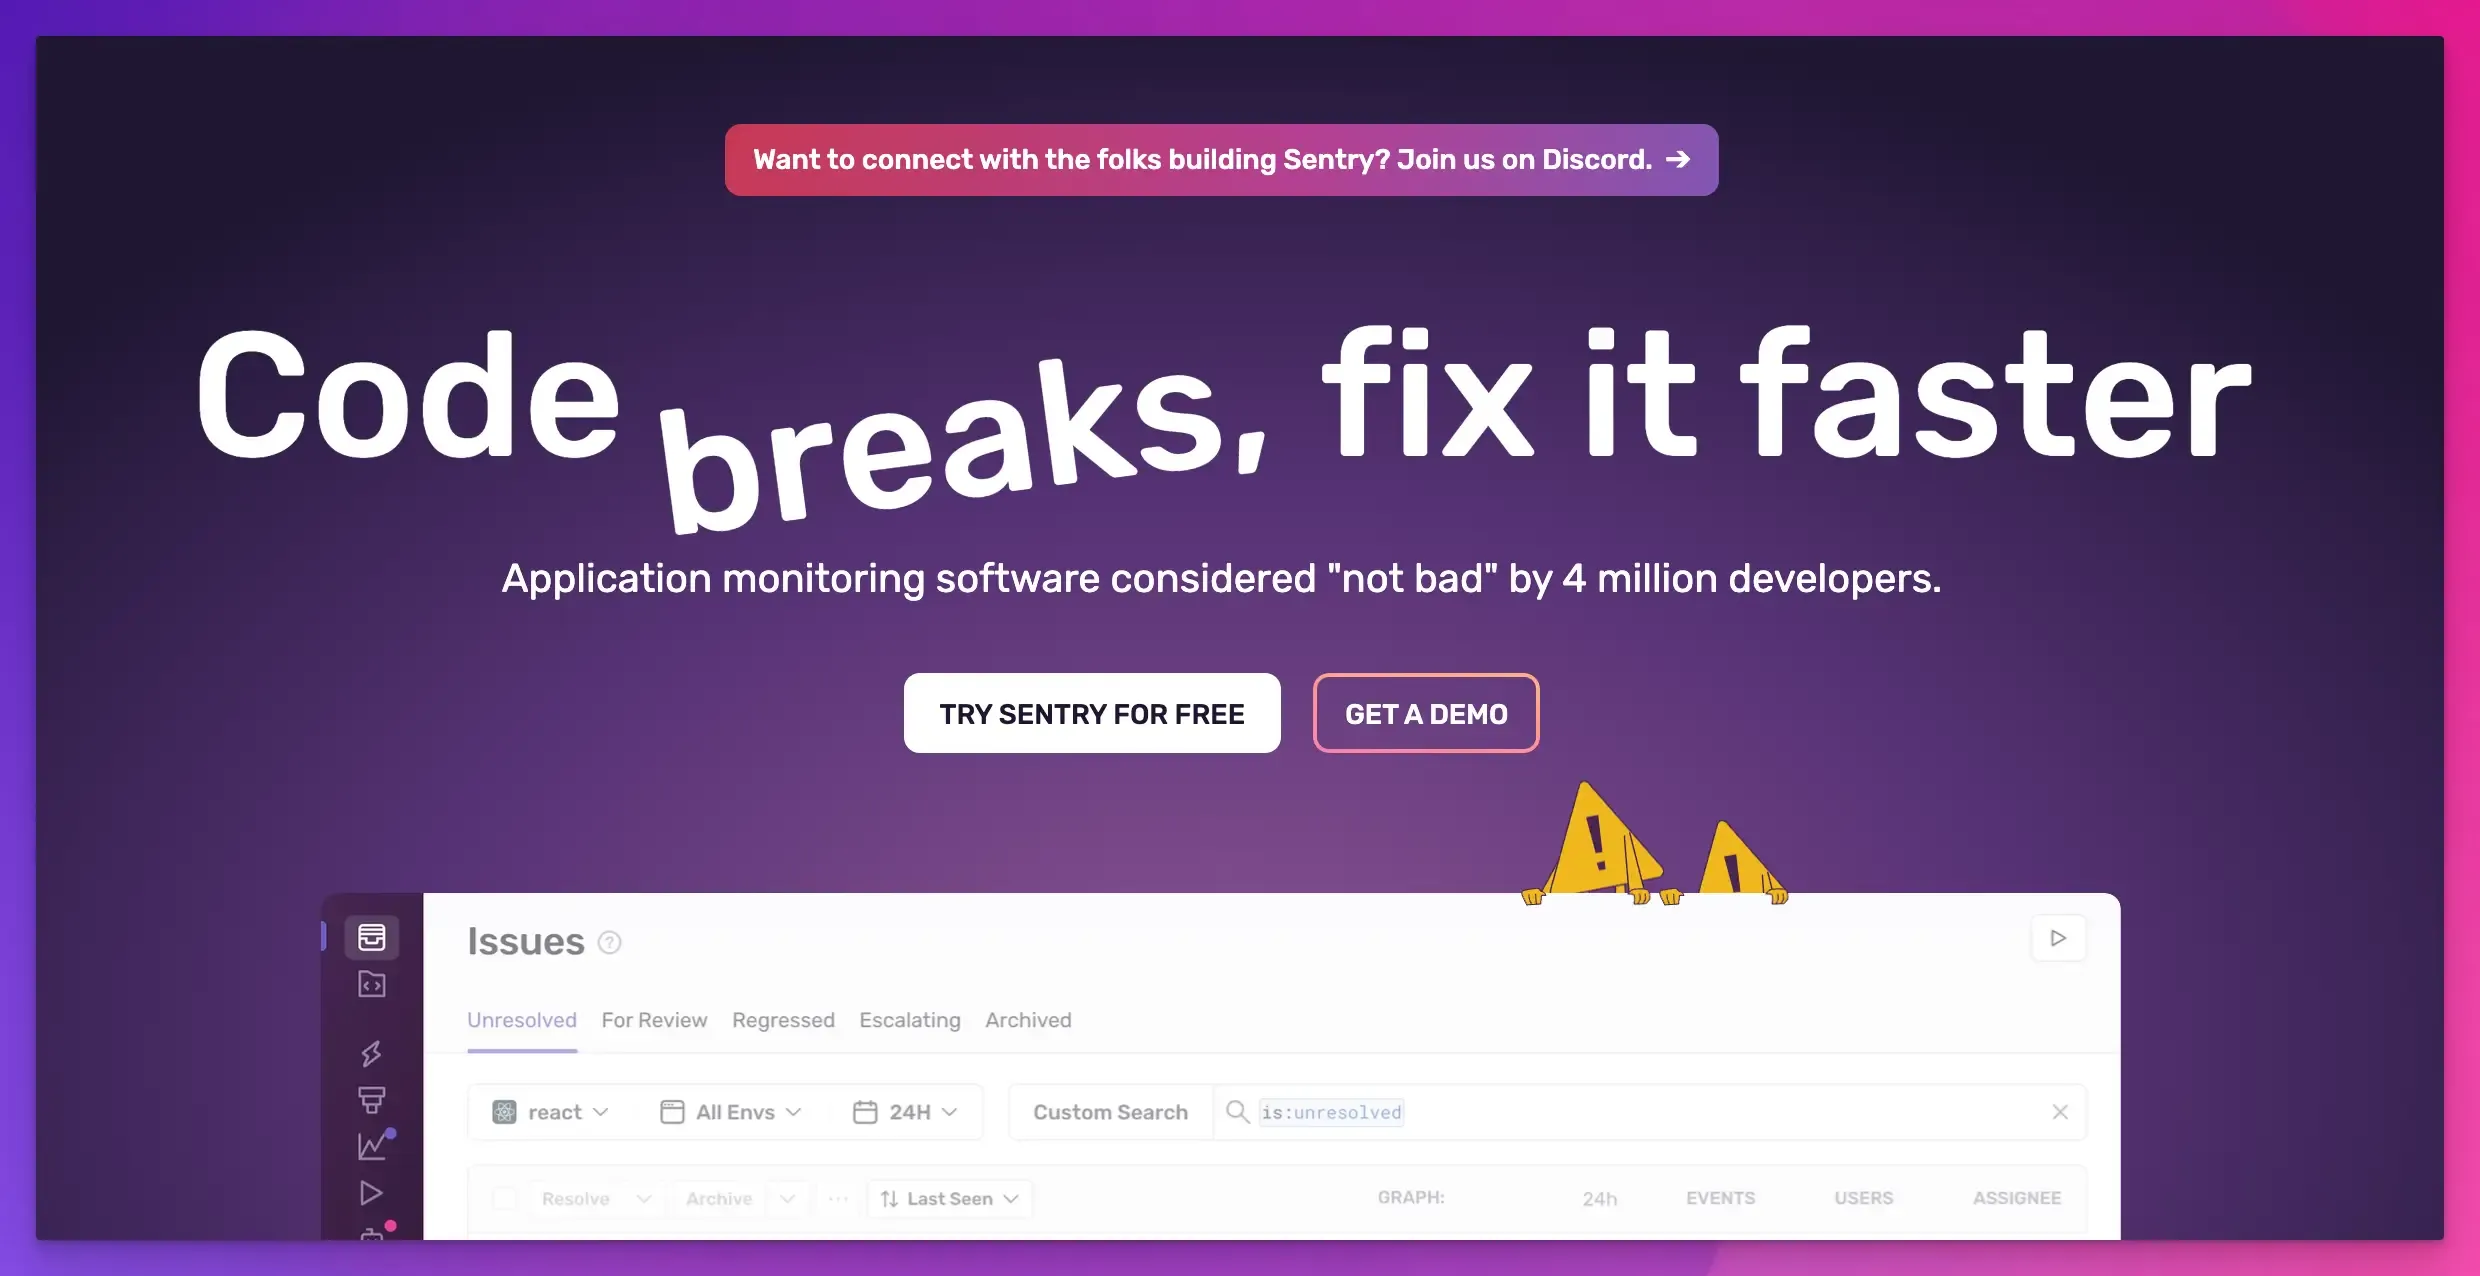
Sentry is another popular tool that helps developers monitor and fix errors in real-time.
It supports multiple programming languages and automatically tracks critical performance issues before they affect users.
Key Features:
- It monitors and debugs errors as they happen in your application, allowing for quick resolution with custom alerts.
- You can watch replays of real user sessions to learn where, how, and when issues occur.
- Debugging features include console output, network calls, and DOM tree inspection.
- Distributed tracing to help you visualize the path of a request from frontend to backend and across services.
- JavaScript source maps help you trace errors in minified or compiled code.
- Integration with popular tools like GitHub, Slack, and Jira to easily manage and resolve issues.
Pros:
- Detailed error reports to help you understand and fix issues proactively.
- Full-stack monitoring with a focus on user impact.
Cons:
- Limited features in the free version.
- Setup can be complex for beginners.
Pricing:
- Free version available.
- Pricing starts from $26 per month.
Zipy
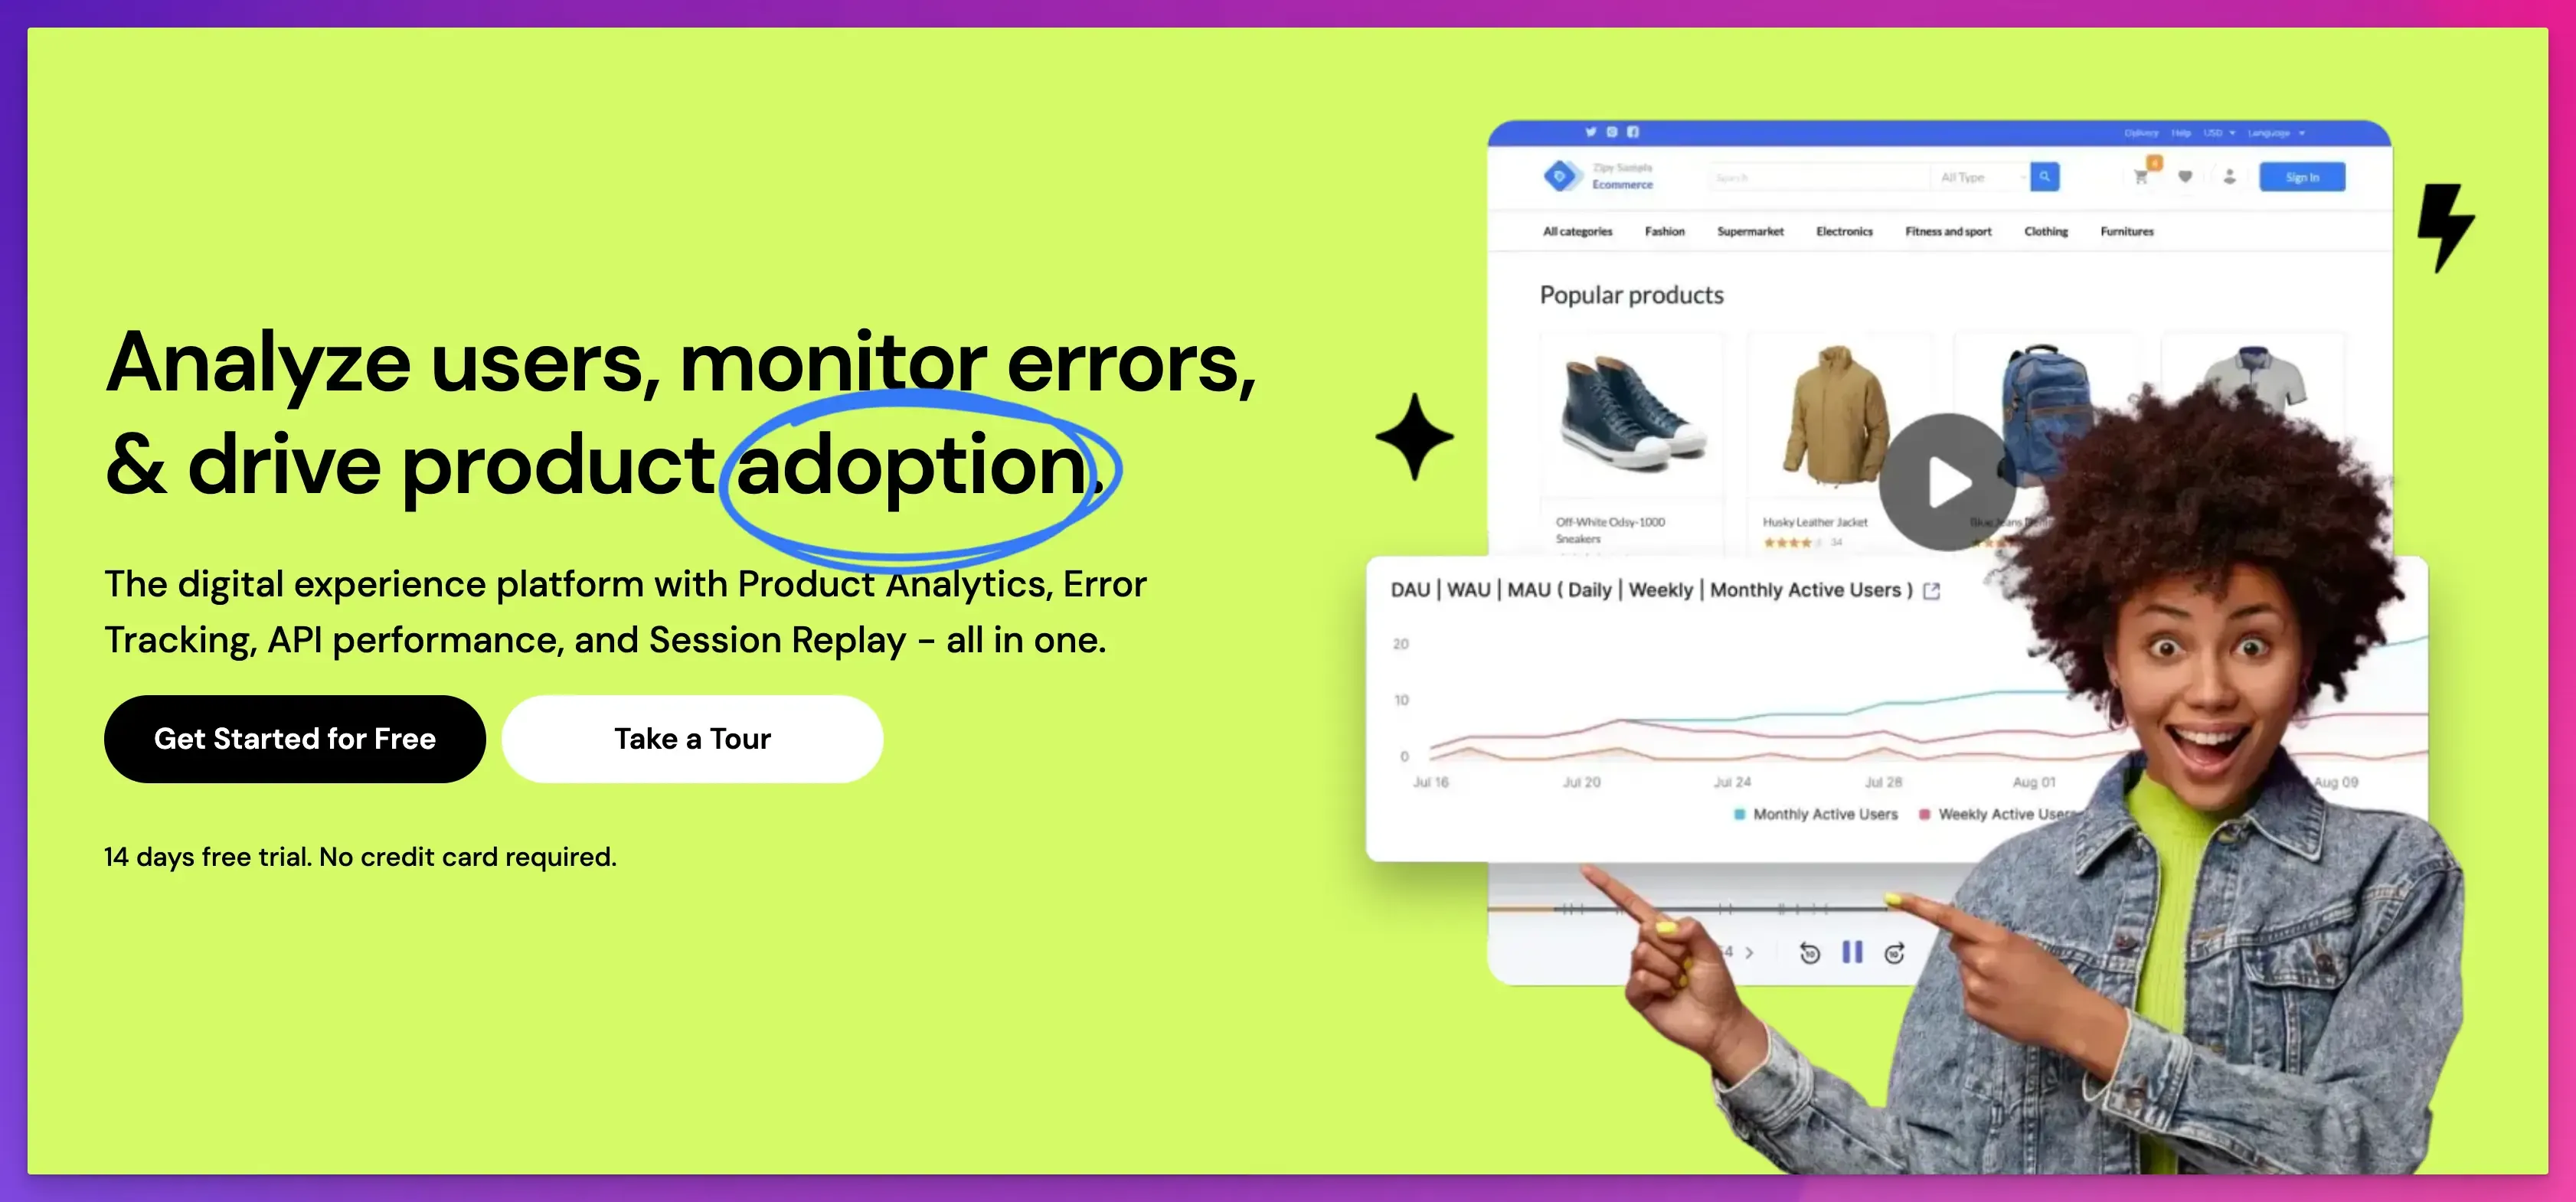
Zipy is a JavaScript and API error monitoring and debugging tool.
It provides a unified platform to identify and resolve issues with real-user monitoring, behavior analytics, and session replays.
Key Features:
- It records user sessions, allowing you to replay and see how users interact with your website and what errors they face.
- Its error analytics dashboard lets you view errors by type, trends, location, and environment.
- Advanced dev tools, such as console logs, network logs, and stack traces, allow you to see what is going on at the code level.
- Integrations with all popular frontend frameworks, libraries, and tools like Slack, Jira, and GitHub.
Pros:
- Detailed user insights with session replays, heatmaps, and live user tracking.
- Easy issue tracing with actionable alerts.
Cons:
- Steep learning curve for new users.
- It can be costly for small projects.
Pricing:
- Free plan available.
- Pricing starts from $39 per month.
ESLint
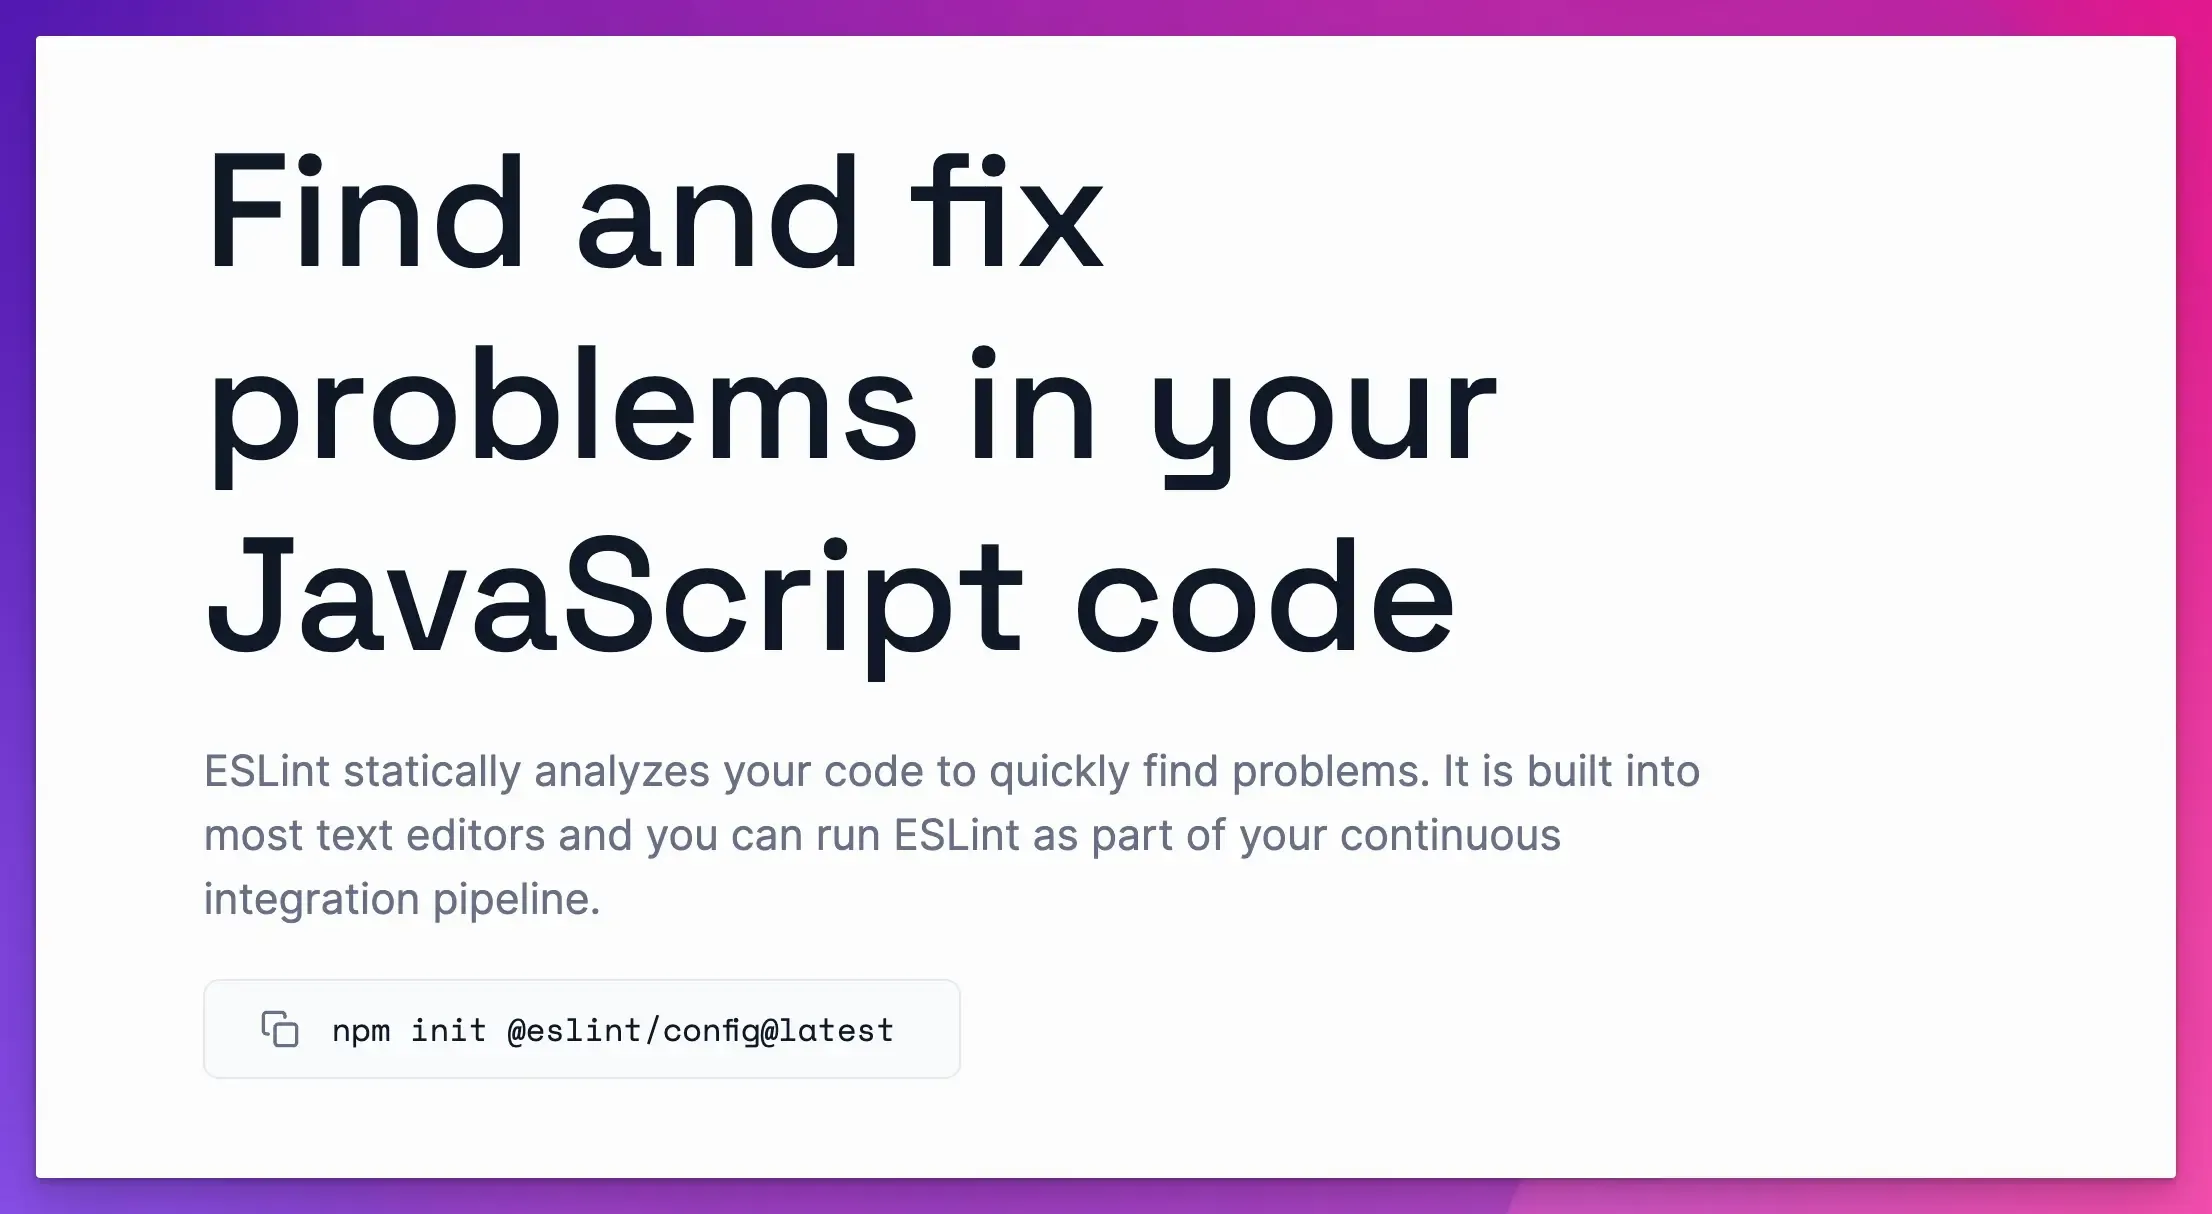
ESLint is a powerful JavaScript debugging tool that automatically checks and improves the quality of your code.
It is an open-source linting utility that analyzes static code to find and fix syntax errors, typos, and style issues.
Key Features:
- ESLint has predefined linting rules that you can configure and run as needed.
- You can also write your own rules or change existing ones to fit your coding standards.
- It can be integrated into all major browsers, operating systems, and code editors.
- You can run it as part of your CI/CD pipeline to catch issues before they are deployed.
Pros:
- Best tool for maintaining code quality and best practices.
- Highly flexible with a lot of customization options.
Cons:
- Initial setup can be complex and time-consuming.
- May result in false positives.
Pricing:
Free.
Airbrake
Airbrake is another powerful tool that tracks app performance and fixes real-time errors.
Its JavaScript debugger automatically finds bugs in your code and provides detailed reports about where and why an error occurred.
Key Features:
- It is lightweight and easy to install, supporting all major languages and frameworks, including PHP, Python, and Java.
- It provides real-time monitoring and alerts, allowing you to address issues proactively.
- It tracks the deployment version to help you see if a recent code change caused new errors.
- It integrates with popular tools like Slack, GitHub, GitLab, Jira, Trello, and more.
Pros:
- Error tracking and performance monitoring across the entire stack.
- In-depth diagnosis with a focus on user impact.
Cons:
- Requires an internet connection to receive error reports.
- It can be expensive for large projects or teams.
Pricing:
- Free trial available.
- Pricing starts from $19 per month.
How to Choose the Right Tool for JavaScript Debugging?
Choosing the right tool depends on key factors, such as your project’s requirements and the problem you face.
For example:
- If you want to debug syntax errors, you can use a linter like ESLint.
- You can use a standalone debugger or a profiling tool for large projects and performance issues.
- Browser developer tools might be all you need for small projects or minor issues.
- Visual Studio Code’s built-in debugger might be the best choice if you use it.
Here are a few things to consider before you make a decision:
- Ease of Use: Your debugger should be easy to use to reduce the learning time.
- Integration: Check the integration capabilities of your tool to see if it is compatible with your existing workflow and development environment.
- Resource Utilization: It should not slow down your system or interfere with your workflow, especially in large projects.
- Community Support: Your chosen tool should have an active community and customer support. It should offer resources like online tutorials and documentation.
- Scalability: Choose the tool that will still be useful as your project grows.
snappify will help you to create
stunning presentations and videos.
Final Words
The success of any web development project depends on having the right tool in your toolkit.
We have listed some of the best JavaScript debugging tools, each with unique features and benefits.
Choose one that fits your coding style, project requirements, and budget, and start coding like a pro.
If you like this article, you will also enjoy reading:
FAQs:
How to set breakpoints in JavaScript?
To set a breakpoint in JavaScript, open the browser’s developer tools, go to the “Sources” tab, find your script, and click the line number where you want to pause execution.
How to debug JavaScript errors in VS Code?
To debug JavaScript errors with VS Code, add breakpoints to your code, launch the debugger, and analyze the call stack and variables in the Debug panel to find and fix issues.