7 Best Error Monitoring Tools for Developers (2024)
Bugs and errors are a major challenge in software development.
Debugging can take hours, especially when you don’t know where the problem is or how severe its impact is.
Even a small bug in your code can cause unexpected crashes, slow down your application, and leave a negative impression on users.
That’s why you need error monitoring tools to detect and report problems immediately.
These tools automatically track, alert, and help you fix issues before they affect users.
We have listed the top error monitoring tools to help you keep your projects on track and maintain stable performance.
Let’s get started.
What Are Error Monitoring Tools?
Error monitoring tools are software solutions that provide detailed information about your application’s health and notify you when something goes wrong.
The visibility provided by crash or error monitoring eliminates the guesswork in detecting issues and helps you pinpoint the exact problem affecting performance.
For example:
Imagine a website suddenly stops working correctly.
Without an error monitoring system, you might not realize there is an issue until users start complaining.
But with the right tool, you receive a notification as soon as the error occurs, so you can fix it before it affects too many users.
These tools offer many features, including:
- Real-time Alerts: Notifies you immediately when something breaks, allowing you to respond quickly.
- Error Logging: Records details of each error, like where and when it occurred, so you can trace the issue without wasting time.
- Real User Monitoring: Some tools can show which browser the user was using or which action they performed that caused the error, helping you understand the impact.
- Integration: It easily integrates with project management and alerting platforms like Jira or Slack, so you can receive alerts wherever you work.
snappify will help you to create
stunning presentations and videos.
7 Best Error Monitoring Tools
Here is an overview of the best error monitoring solutions with their key features and pricing:
Raygun
Raygun is a powerful error and performance monitoring tool that helps developers detect real-time errors and performance issues.
It offers AI-powered error resolution and actionable insights into user behavior, making it useful for maintaining smooth application performance.
Key Features:
- Full stack trace information, including the exact line of code that caused the issue.
- Monitor your application’s frontend performance from the end user’s perspective to see how issues impact their experience.
- Check deployment versions to see when new issues arise after a release.
- Support for multiple languages and frameworks, including JavaScript, Angular, React, iOS, and Android.
- Filter errors by date, time, version, location, tag, host, OS, browser, and custom tags.
- Attach relevant context to crash reports and user segments using custom data.
- Integrations with popular tools like Jira, Slack, Asana, GitHub, Bitbucket, and GitLab.
Pros:
- Quick and easy to set up and install.
- Application performance and real user monitoring.
- Immediate alerts with custom rules and filters.
Cons:
- Expensive for small projects.
- Might create over-alerts for less critical issues.
Pricing:
- Free trial available.
- Pricing starts from $40 per ****100,000 errors per month.
New Relic
New Relic is an intelligent observability platform that helps developers monitor the performance and health of their applications, infrastructure, and networks.
It provides detailed reports about every error along with application performance monitoring (APM), allowing you to analyze how errors correlate with performance issues.
Key Features:
- Get code-level insights for full-stack visibility.
- Visualize key metrics and dependencies and spot the root cause of issues.
- Track errors by type, frequency, and affected number of users.
- Get automated alerts for key performance indicators (KPIs).
- Playback user interactions with session replays to reproduce issues.
- Group and filter important errors and share the information with charts and dashboards.
- Monitor cross-platform apps (iOS and Android) and identify in-app bugs at the code level with targeted alerts.
- Integrations with 775 third-party tools and services, including GitHub, Jira, Slack, Webhook, Docker, and more.
Pros:
- Unified monitoring for complex websites and applications.
- Detailed analysis of both errors and performance issues.
- AI-powered insights and issue detection.
Cons:
- It can be complex for smaller projects or teams.
- Pricing can be high for advanced features.
Pricing:
- Free tier available with 100 GB of data.
- Pay-as-you-go pricing model starting from $0.35 per GB.
Sentry

Sentry is a popular application monitoring software that helps developers monitor and fix real-time errors.
It supports multiple programming languages and frameworks, making it popular across web, mobile, and native application development.
Key Features:
- Instantly capture errors as they happen, with detailed stack traces and context.
- Watch replays of user sessions to understand where users are getting stuck.
- Find the root cause, including the environment, device, OS, and the broken line of code.
- Debug with visual context, including console output, network calls, and DOM tree inspection.
- Automated custom alerts to set up notifications for specific error types or performance issues.
- End-to-end distributed tracing to visualize the path of a request across services.
- Integration with popular tools like GitHub, Azure DevOps, Bitbucket, GitLab, Slack, and Jira.
Pros:
- Easy to set up with multiple programming languages.
- Error grouping to reduce noise and focus on the most critical issues.
- Full-stack monitoring with detailed reports.
Cons:
- Limited features in the free plan.
- Configuring custom alerts can be complex for beginners.
Pricing:
- Free plan available.
- Pricing starts from $26 per month.
Rollbar
Rollbar allows developers to detect, diagnose, and fix errors in real-time before users are impacted.
It is known for its fast integration and actionable insights, making it suitable for small projects and enterprise applications.
Key Features:
- See errors as they happen and monitor all related microservices in one view.
- Automatically group similar errors to reduce noise and prioritize critical issues.
- Set up custom notifications for specific error types or thresholds.
- Visualize the deployed code version across multiple projects and get all the code context and metadata you need to resolve errors.
- Get breadcrumbs of events leading up to the error, including user actions, page loads, network activity, and console logs.
- Integrations with the tools like Jira, Slack, GitHub, PagerDuty, and more.
Pros:
- Easy to integrate into various programming languages and frameworks.
- Provides detailed, actionable insights with automatic error grouping.
Cons:
- Setting up custom filters can be complex for new users.
- Limited filtering may result in alert fatigue.
Pricing:
- Free plan available.
- Pricing starts from $15.83 monthly (for a 25K event volume).
BugSnag
BugSnag provides safe, scalable error tracking, focusing on software application stability management.
It helps developers find and resolve errors across various platforms, including web, mobile, and server-side applications.
Key Features:
- Measure the stability of your application by analyzing crash rates and user impact.
- Automatically assign and prioritize errors based on severity and the number of affected users.
- Get snapshots of crash data and visualize the health of your app in the error inbox.
- Filter errors based on time, users, release stages, and operating systems.
- Group instances of the same underlying errors to minimize noise.
- Investigate trends and specific incidents or track deployments to link errors to specific versions.
- Integrations with GitHub, Slack, Asana, Jira, Microsoft Teams, Trello, and more.
Pros:
- Advanced search and segmentation features.
- Strong support for mobile platforms.
Cons:
- It can be costly for larger teams.
- Advanced features and custom configurations can be complex.
Pricing:
- Free plan available.
- Pricing starts from $20 per month.
LogRocket
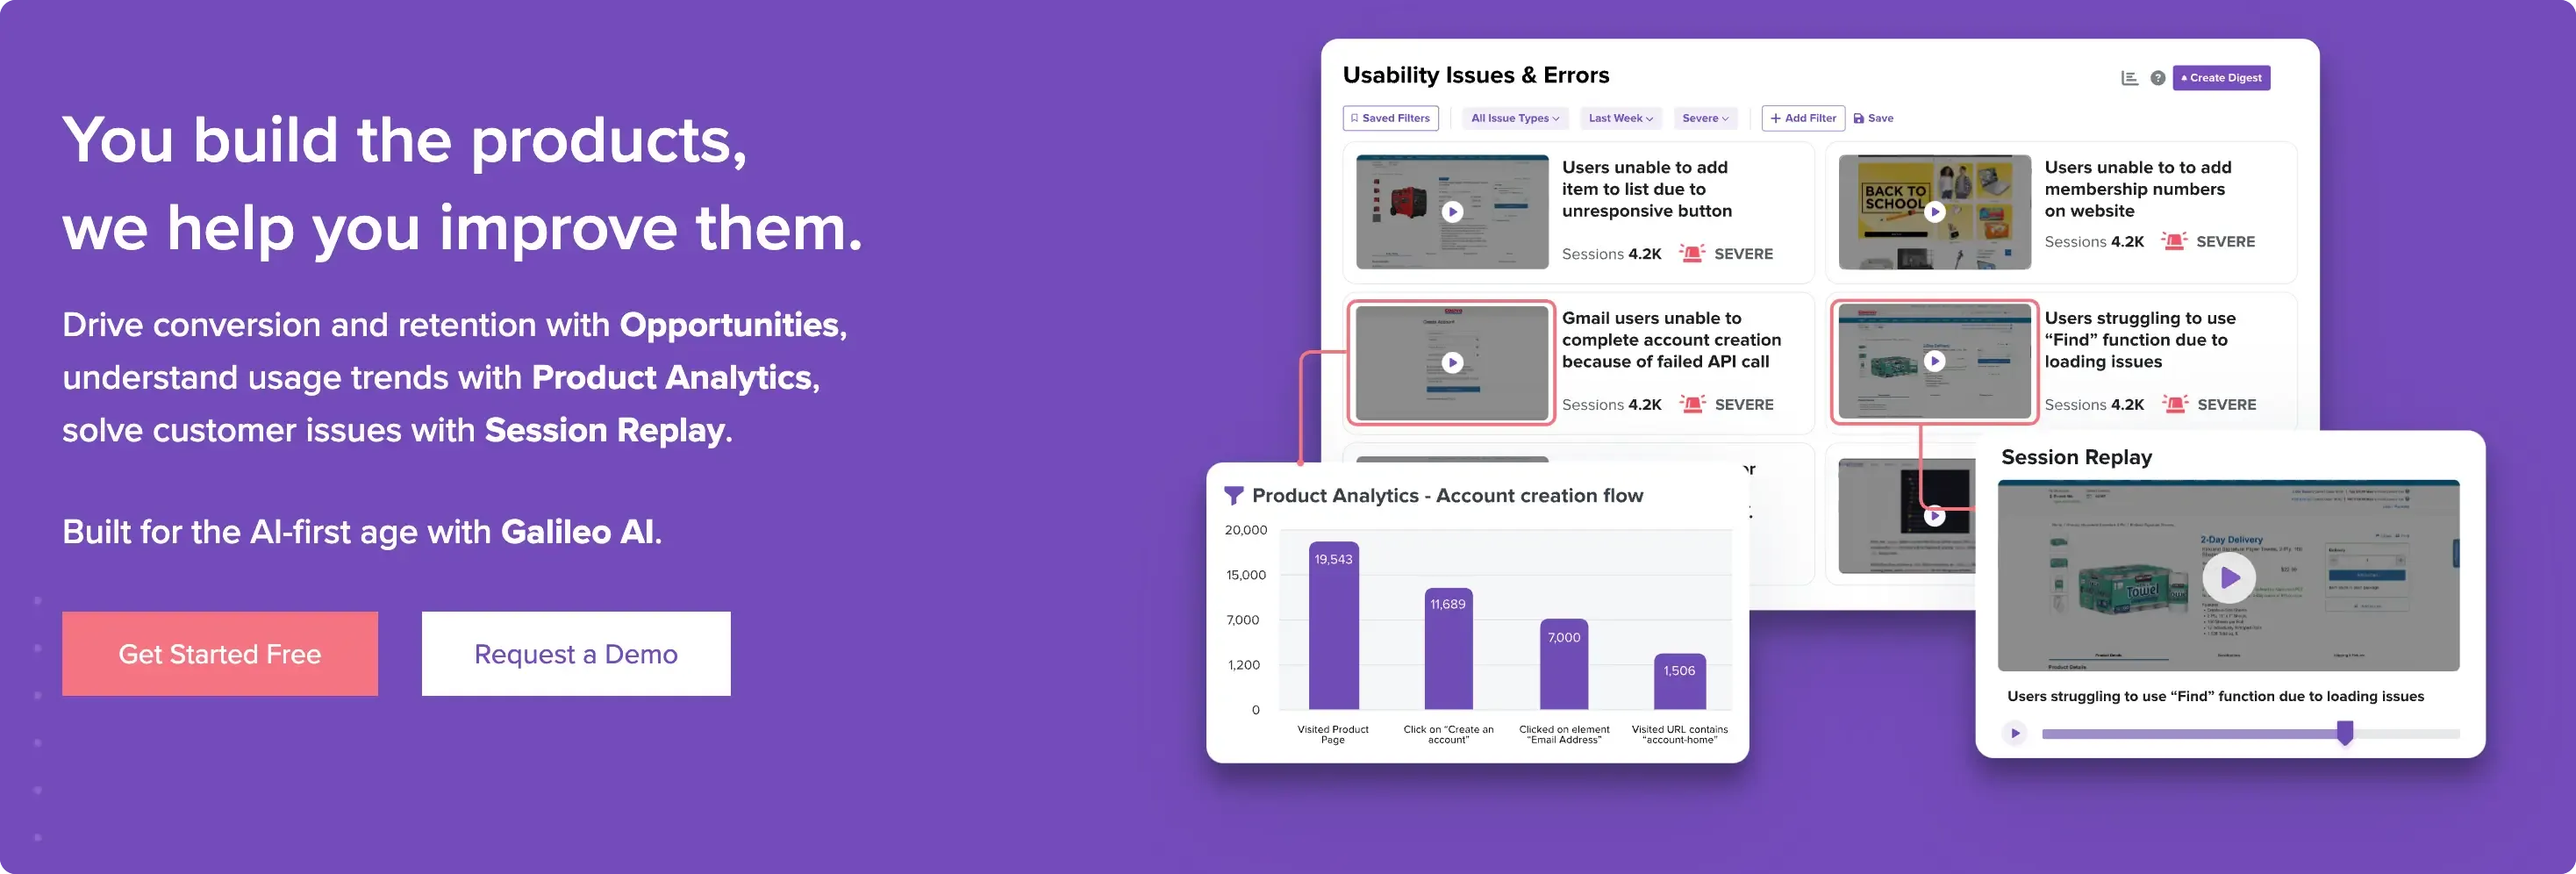
LogRocket combines error monitoring with session replay and performance analytics.
It offers comprehensive session records, logs of JavaScript errors, network requests, and performance metrics, making it a great tool for learning how users interact with your application.
Key Features:
- Session replay to record user sessions and catch every interaction.
- Automatically detect the most severe issues that impact business goals and KPIs.
- AI-powered issue descriptions to understand what happened.
- Group issues by priority level and set rules to sort new issues as they occur automatically.
- Review stack traces and source maps to pinpoint the exact line of broken code.
- Integrations with Slack, Jira, email, PagerDuty, and Microsoft Teams.
Pros:
- Smart alerting and segmentation.
- Visual playback of user actions.
Cons:
- Session recordings require high data usage.
- It is expensive for applications with heavy traffic.
Pricing:
- Free plan available.
- Pricing starts from $69 per month.
Airbrake
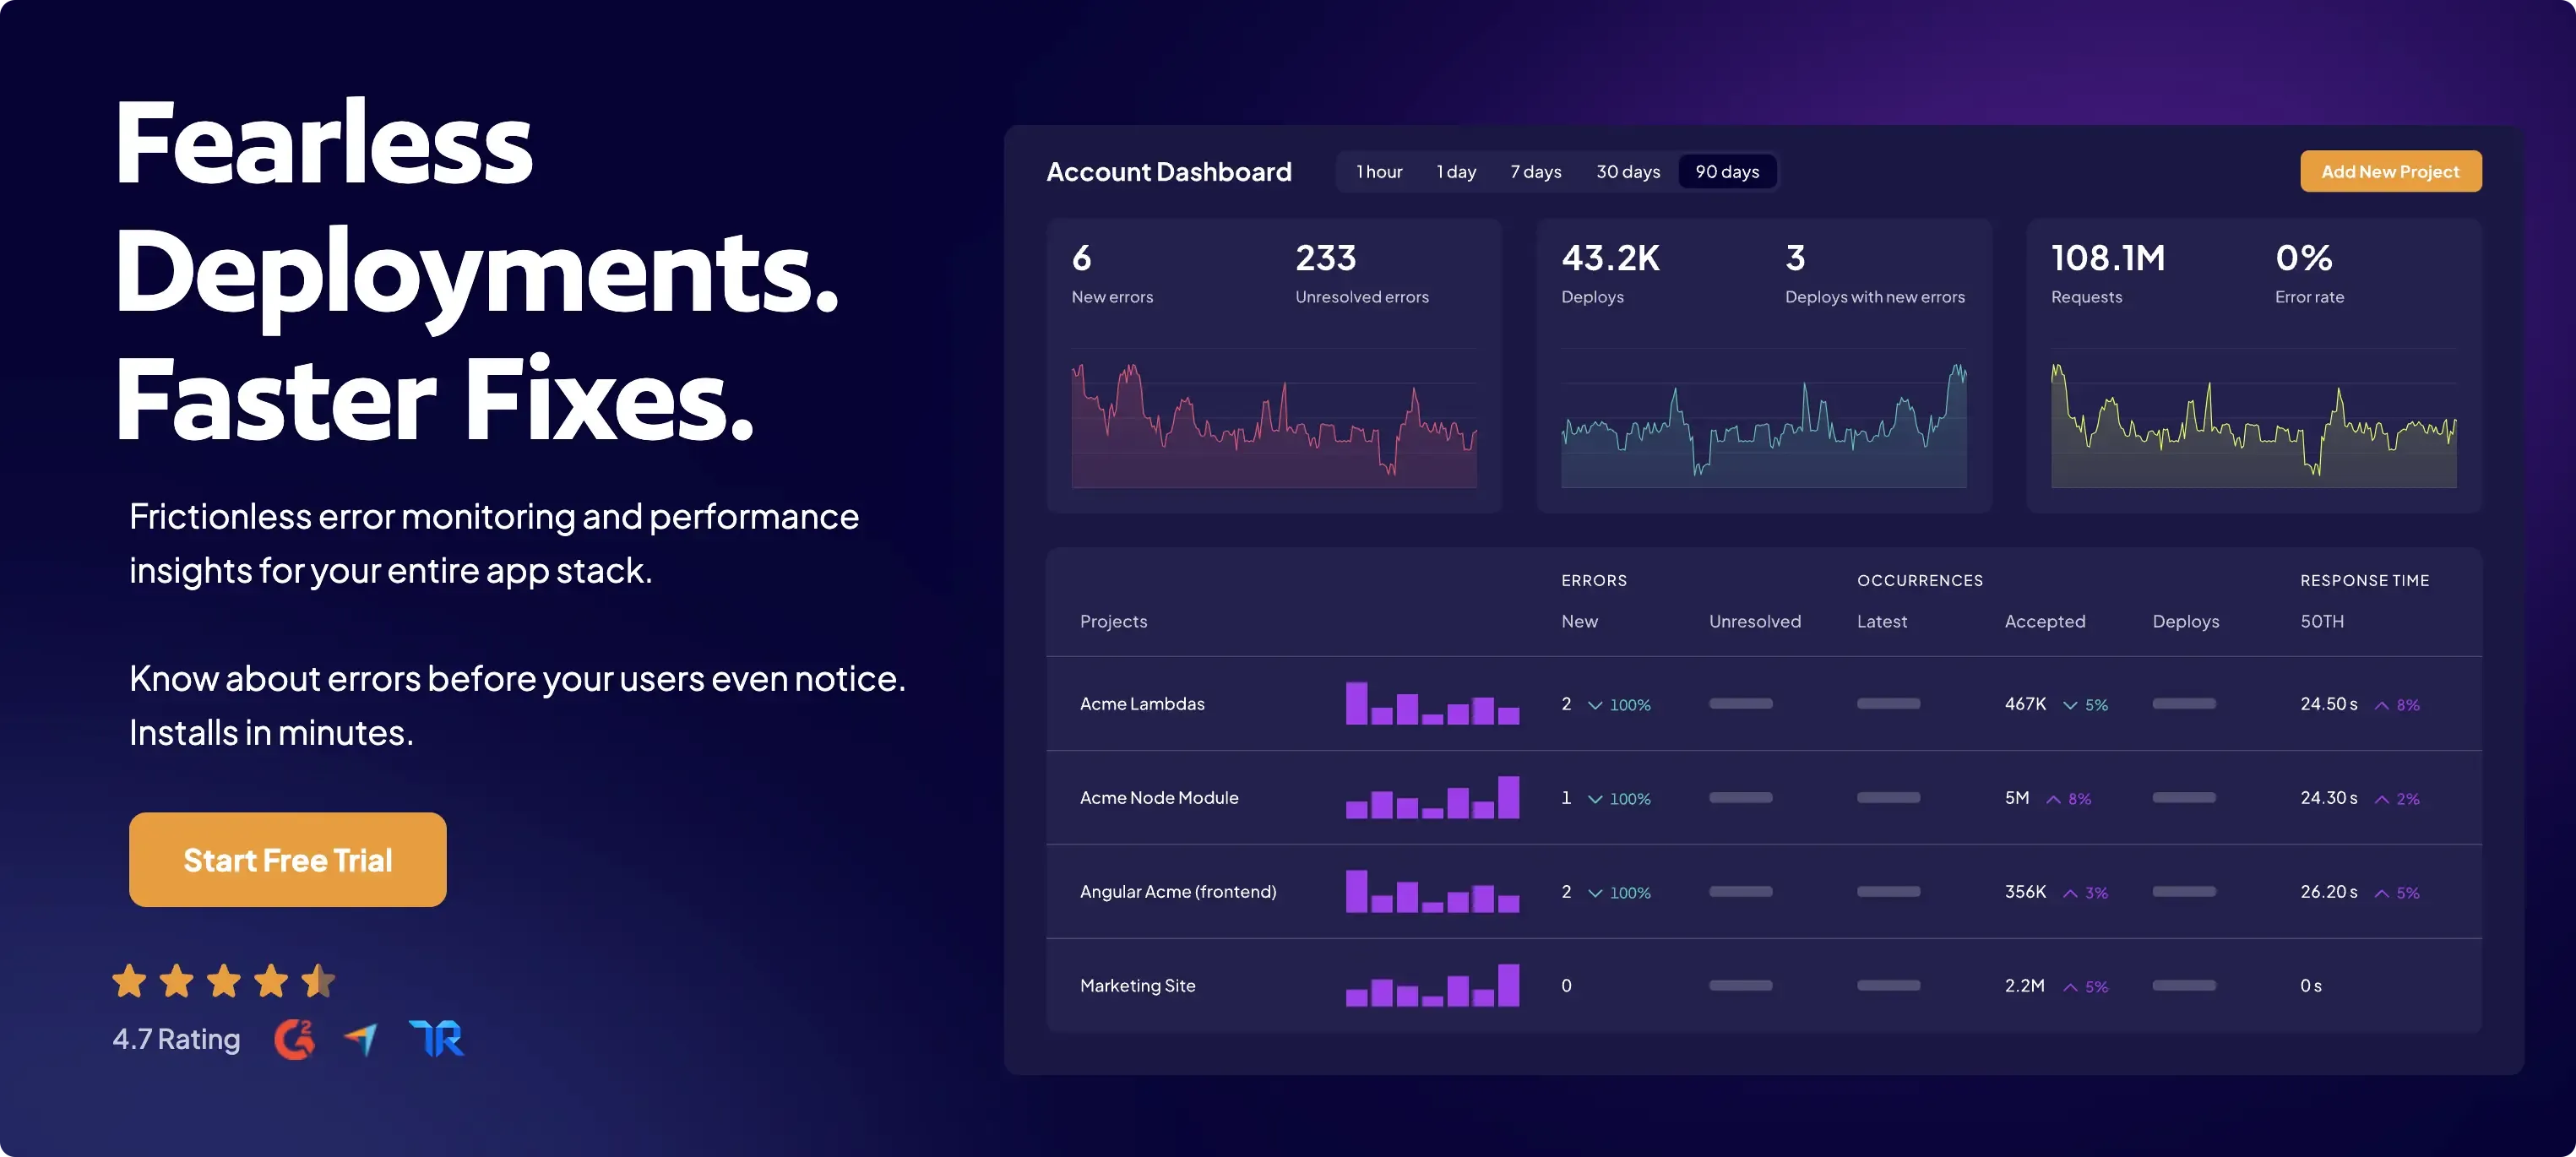
Airbrake is a good choice for software teams looking for a straightforward error-tracking solution to manage errors in real-time.
It provides rich diagnostics, making it easier to find out the root cause of issues and resolve them before they affect users.
Key Features:
- It provides real-time error alerts and detailed reports, including stack traces, environment data, and user context.
- Supports all major languages and frameworks.
- Get breadcrumbs of the events that caused the error so you can reproduce it.
- Link errors with specific deployments or releases to improve code quality.
- Use hotspots and insights to prioritize high-risk errors and files.
- Integrations with tools like Slack, GitHub, GitLab, Jira, Trello, and more.
Pros:
- Quick setup and integration with multiple languages and frameworks.
- Full-stack error and performance monitoring.
- Detailed diagnosis with a focus on user experience.
Cons:
- User interface can be difficult to navigate when dealing with many issues.
- It can be costly for larger teams.
Pricing:
- Free trial available.
- Pricing starts from $19 per month.
snappify will help you to create
stunning presentations and videos.
Final Words
We have handpicked the best solutions in the market for error handling and issue resolution.
Each of these tools has unique strengths and features, making it suitable for different types of projects and development needs.
Choose the right error monitoring tool based on your requirements and never miss a bug again.
If you like this article, check out our analysis on:
FAQs
What features should I look for in an error monitoring solution?
When searching for an error monitoring solution, look for features such as:
- Real-time error tracking, session replay, or performance monitoring.
- Compatibility with your tech stack.
- Easy setup and integration capabilities.
- Customizable alerts and detailed reports.
What are some common challenges faced when implementing error monitoring tools?
Common challenges include:
- Integration with existing tech stacks.
- Configuring proper error reporting system.
- Customizing notifications and filters.
- Managing the volume of error data generated.
