15 Best Application Monitoring Tools (2024)
As a software developer, your top priority is to guarantee your applications don’t crash or slow down.
You know that application performance and reliability are critical for business success, but monitoring them can be complicated and time-consuming.
That’s where application monitoring tools come in.
We’ve done the hard work for you by evaluating the best application monitoring tools to simplify the process so you can make sure that your applications run smoothly and efficiently to provide optimal user experience.
What is Application Performance Monitoring?
Application performance monitoring (APM) is the process of tracking and analyzing application performance and health using various metrics to verify that they function as intended without any issues.
Key performance metrics include:
- Response times.
- Error rates.
- Resource utilization.
- User experience monitoring.
snappify will help you to create
stunning presentations and videos.
Benefits of Application Monitoring Tools
Application monitoring tools provide real-time insights into performance metrics so you can proactively identify and resolve issues before they impact users.
Here are some benefits of using APM tools:
- Identify performance bottlenecks and troubleshoot issues to improve app performance.
- Provide detailed logs and reports about app performance to guide future improvements and updates.
- Optimize response times and error rates to make your apps function as expected and provide a positive user experience.
- Monitor your application’s resource needs so you can better allocate your resources.
- Quickly address issues to save time and reduce maintenance costs.
Best Application Monitoring Tools
Here’s an overview of some of the best APM tools.
- New Relic: Advanced analytics and monitoring.
- AppDynamics: End-to-end business transaction performance.
- Dynatrace: Full-stack AI-powered monitoring.
- Datadog: Best for unified monitoring.
- IBM Instana: Automatic monitoring and incident management.
- Sumo Logic: Unified log management.
- SolarWinds: Dependencies mapping and management.
- Splunk: Best for intelligent incident management and predictive analytics.
New Relic
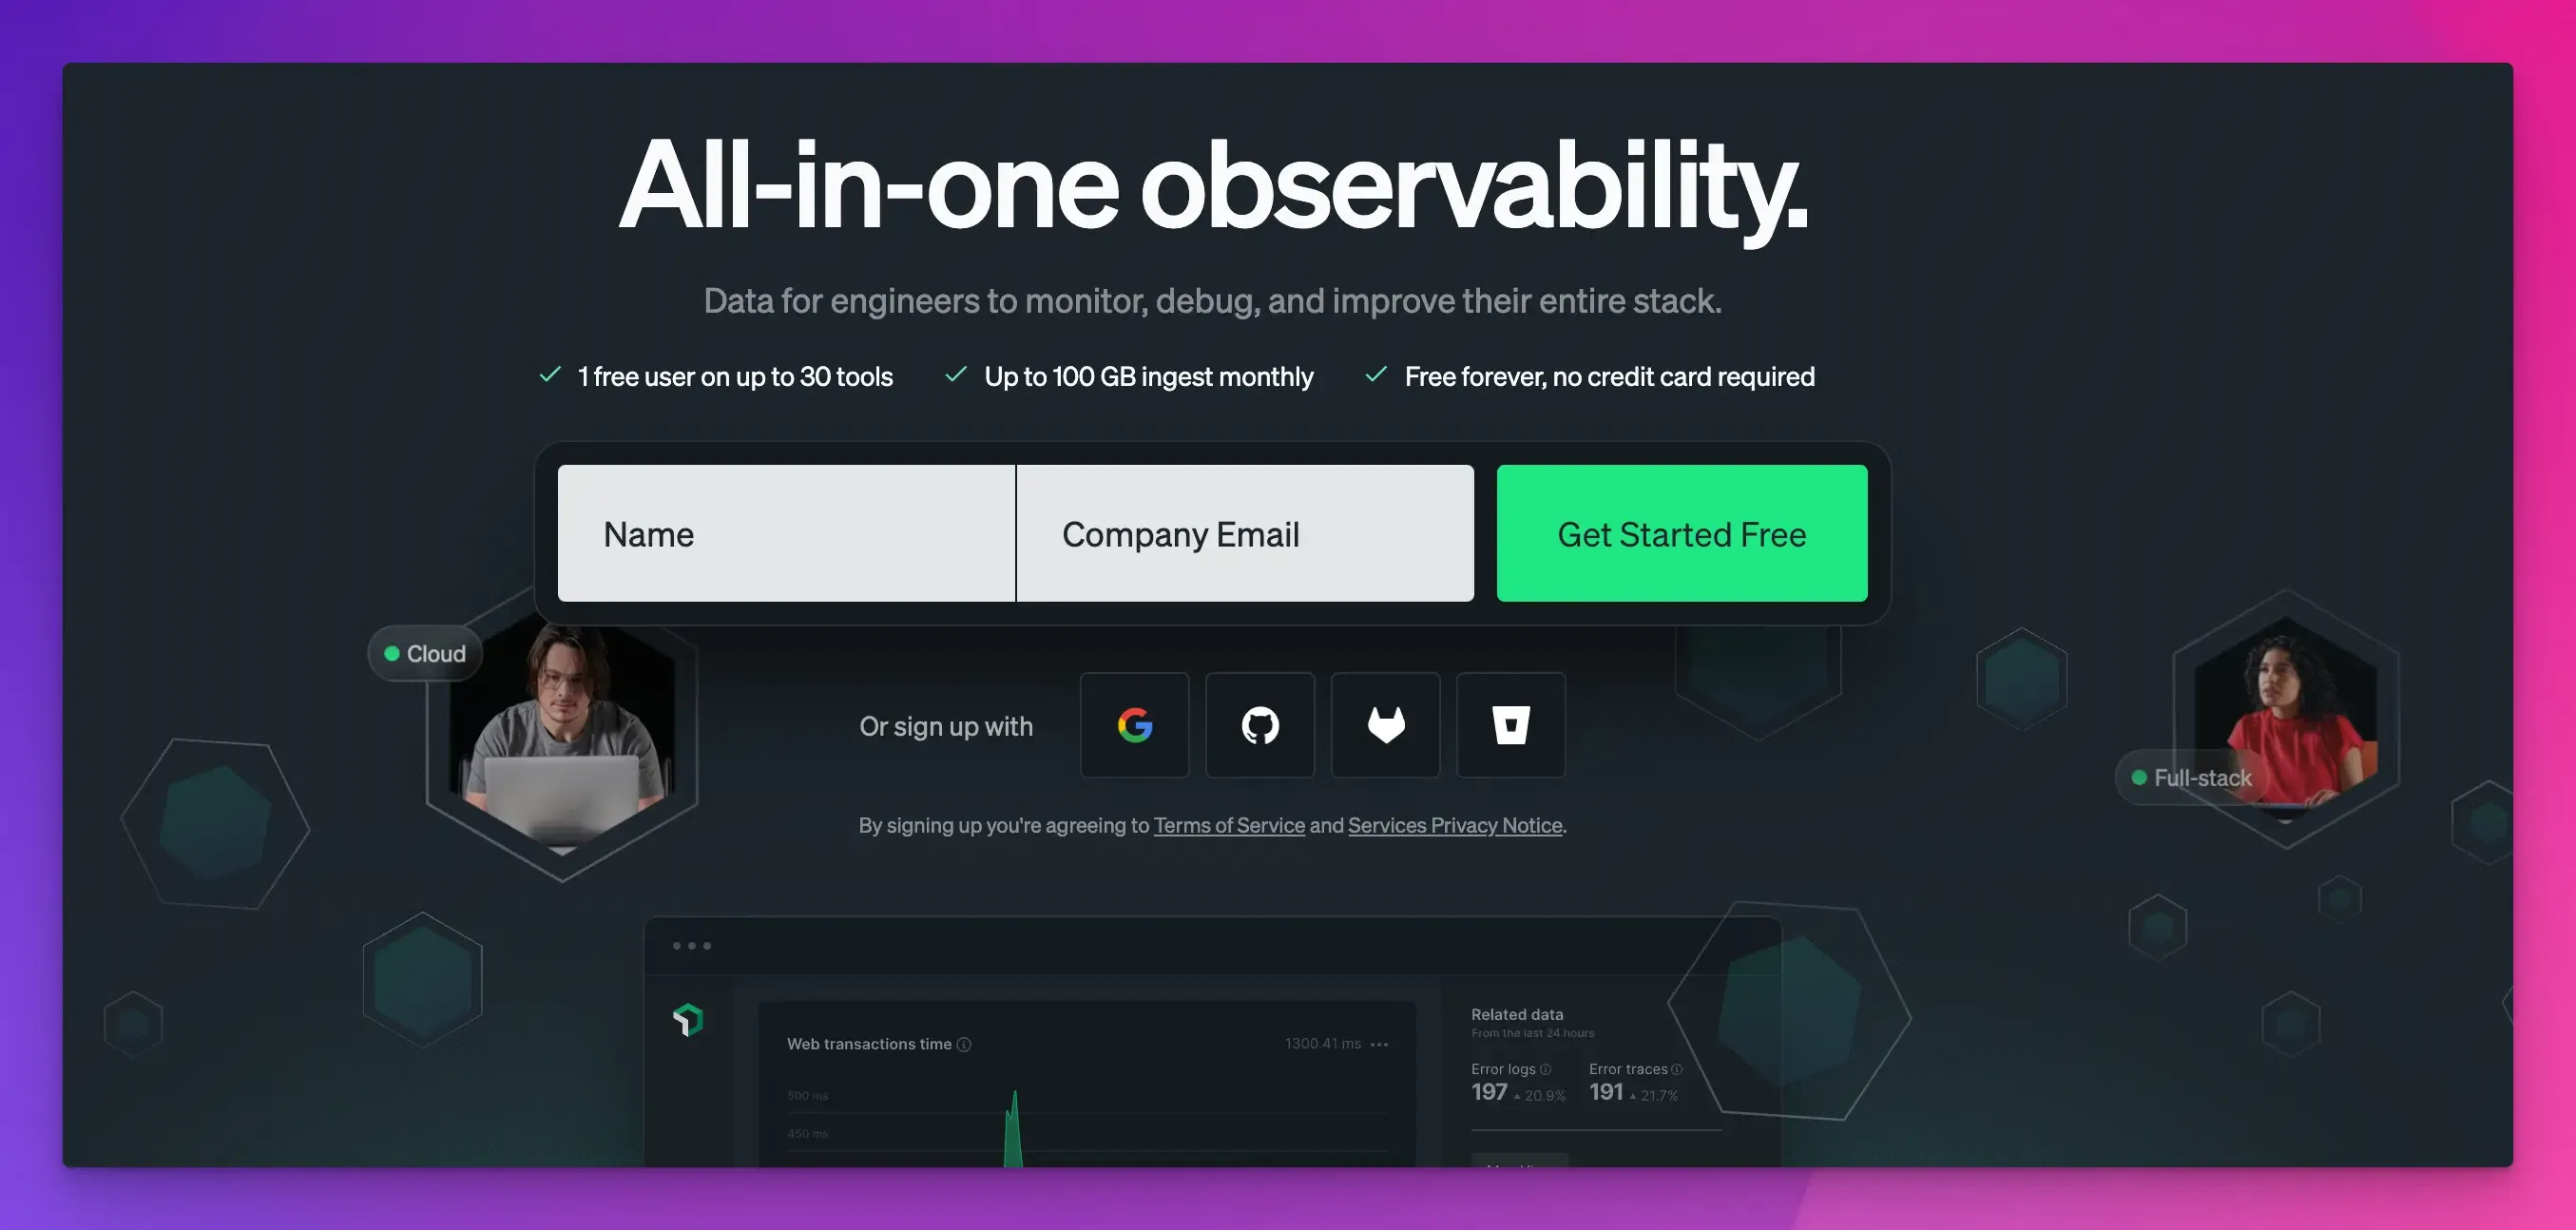
New Relic is an all-in-one observability platform that allows developers and IT teams to monitor applications, infrastructure, and end-user experience.
It provides AI-powered insights into application performance and health so you can proactively monitor and resolve issues quickly.
Key Features:
- Full-stack performance monitoring. New Relic APM is an ideal tool for code-level insights. You can view key metrics to detect the root cause at every stage of development quickly.
- Real-time insights. It offers real-time data analytics and reporting, with log patterns and error user impact view for deep insights and faster troubleshooting.
- Real user monitoring. The APM interface provides real-time monitoring of KPIs to identify issues before they impact users. You can simulate user interactions across browsers and mobile devices.
- Distributed tracing. Get end-to-end visibility into the path of any service request and quickly spot missing alerts to pinpoint issues.
- Integrations. It provides 750+ integrations with third-party tools, which improves versatility.
Pros:
- Easy-to-use interface.
- Customizable dashboards.
- Error tracking with targeted alerts.
Cons:
- Can be expensive for large-scale projects.
- Advanced features might be complex for new users.
Pricing:
- Free tier available.
- Pay-as-you-go pricing model starting from $0.30 per GB.
AppDynamics
AppDynamics is an application performance management and analytics tool that provides unified business and performance insights.
It offers real-time monitoring of the performance of complex applications and end-to-end business transactions.
You can manage and monitor app performance across on-premises, cloud-native, or hybrid environments.
Key Features:
- Full-stack performance observability. It monitors the entire application lifecycle and provides performance insights from code to production. You can monitor code-level transactions that affect the KPIs to improve performance.
- Automated root cause analysis. It uses AI and machine learning to identify the most likely root cause and automatically analyze metrics across your application’s code, storage, infrastructure, or network.
- Intelligent alerts. You can get highly relevant and precise alerts intelligently triggered to reduce false positives and alert storms.
- Integrations. It integrates with tools like AWS and Docker and supports popular programming languages and frameworks.
Pros:
- AI-powered insights into business transactions.
- Analyze applications at the code level.
Cons:
- Complex learning curve for advanced features.
- Pricing can be high for smaller businesses.
Pricing:
It starts from $33 per month.
Dynatrace
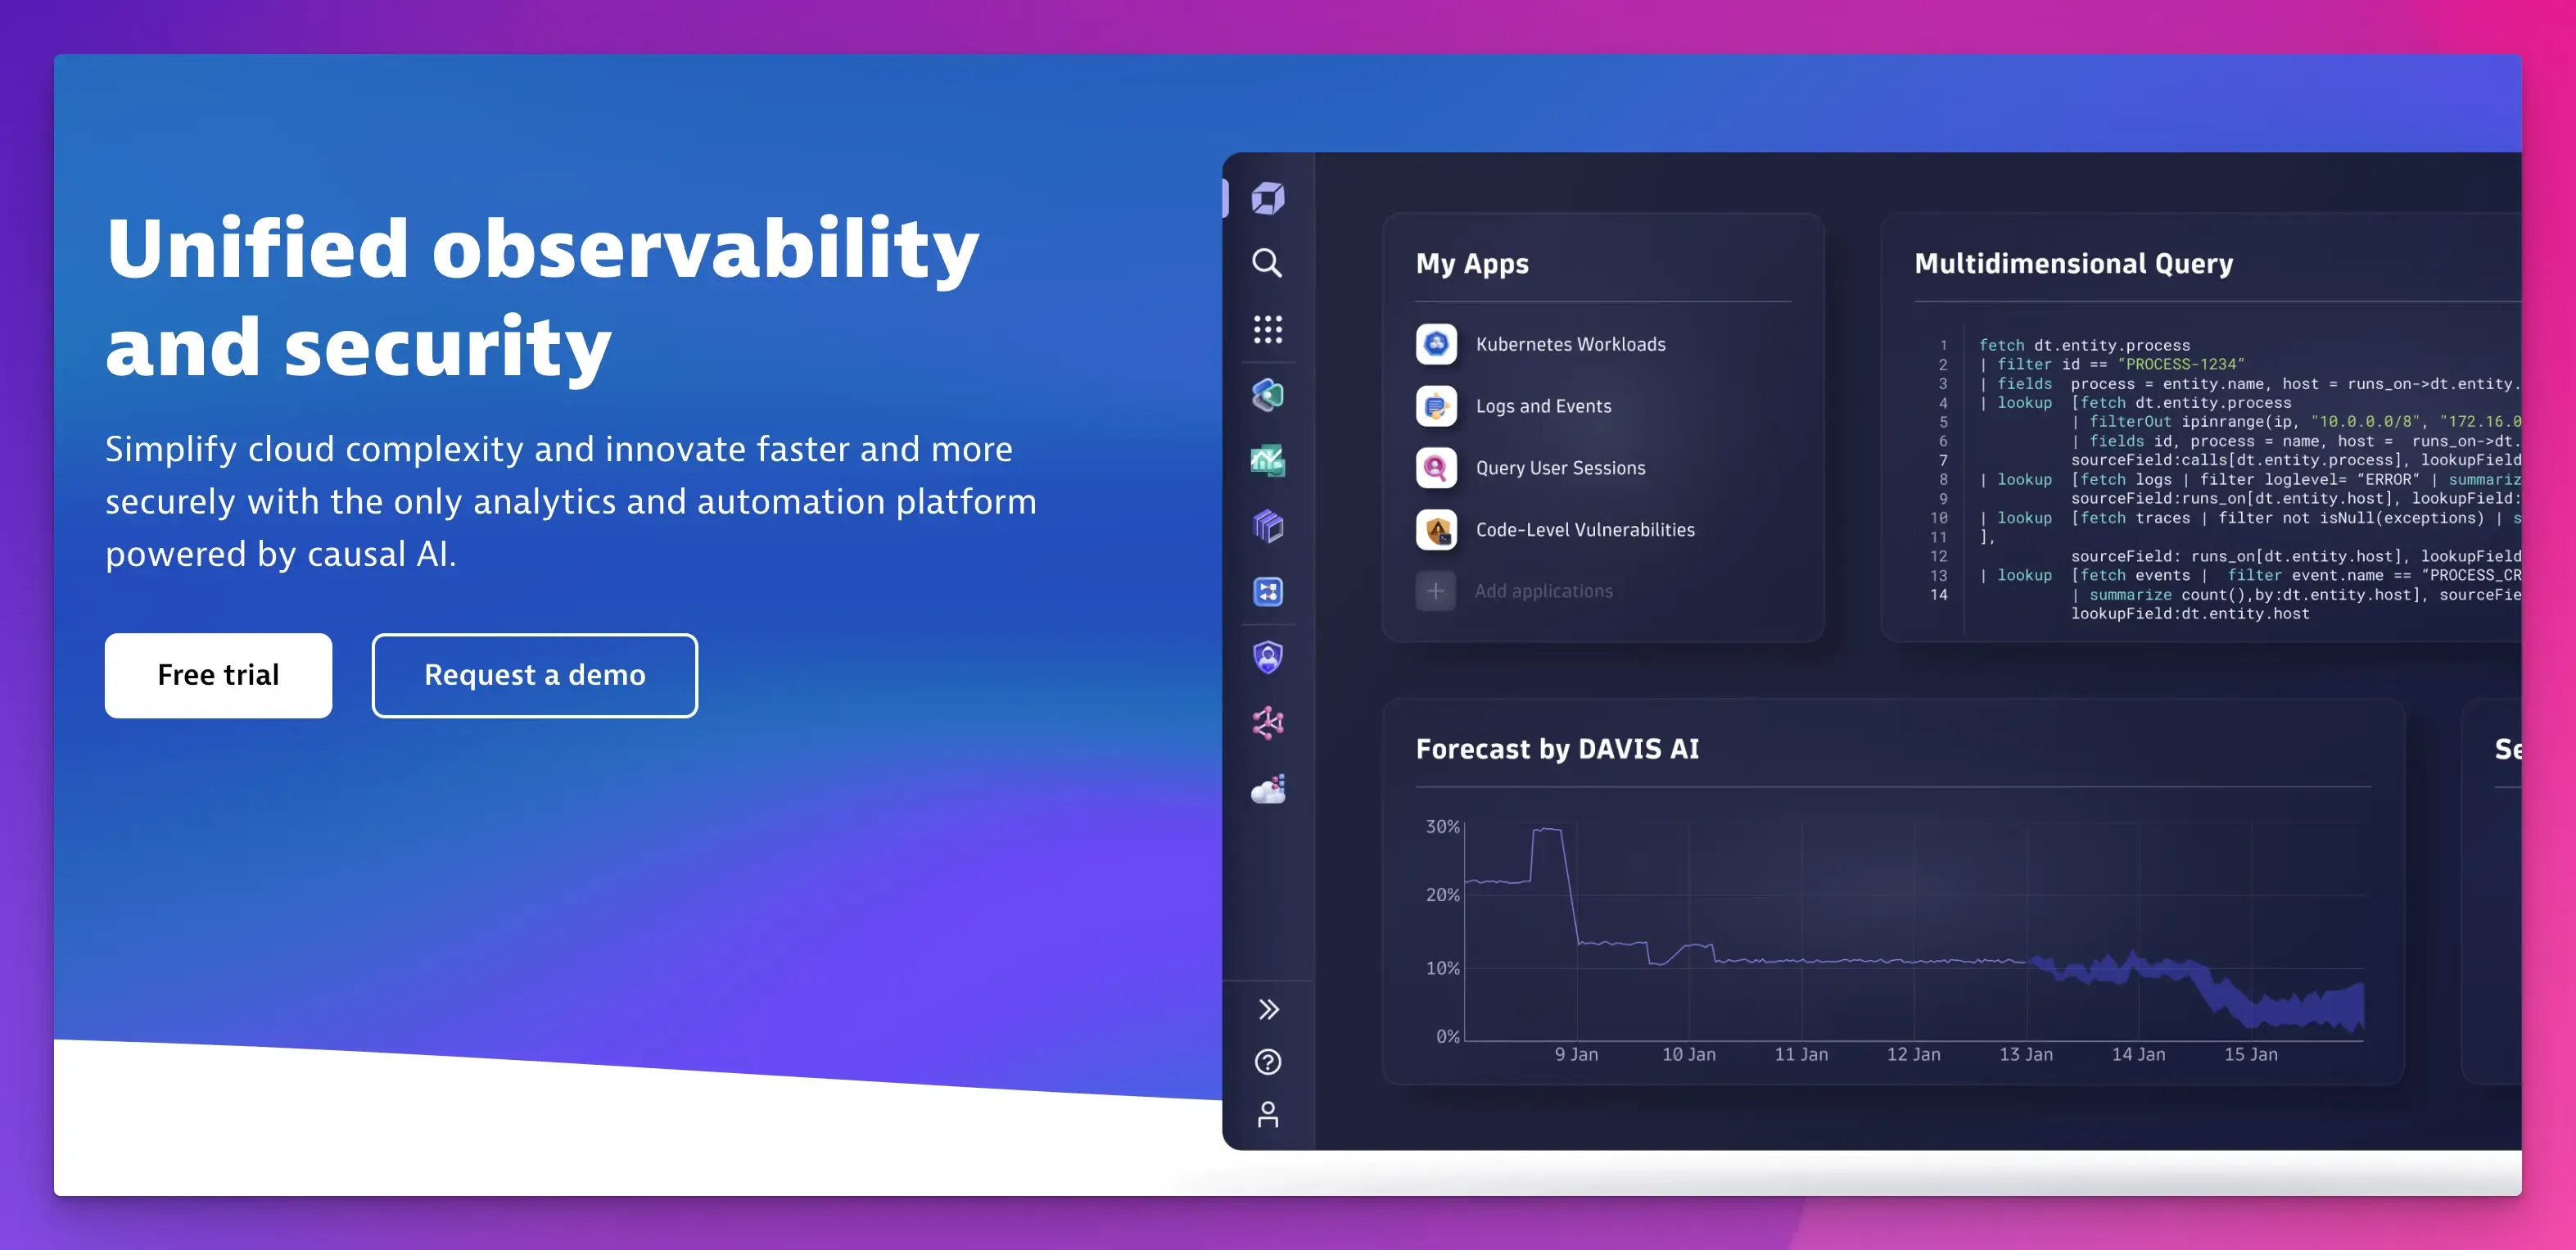
Dynatrace is a powerful software intelligence and observability platform for apps, microservices, and infrastructure.
It provides unified AIOps that automatically identifies problems and provides deep visibility and insights into complex environments.
Key Features:
- Automated full-stack observability. It offers AI-powered end-to-end visibility across the entire technology stack, including applications, infrastructure, security, and cloud environments.
- AI-powered APM. Leverage AI to automatically detect and analyze root causes using topology, transaction, and code-level information. It also provides predictive insights to prevent issues before they impact users.
- Multi-environment monitoring. You can monitor ****private, public, and hybrid cloud environments, VMs, and containers, including AWS, Microsoft Azure, GCP, OpenStack, Kubernetes, and more.
Pros:
- Data lakehouse architecture for causal data processing at scale.
- AI-powered analytics, insights, and automation.
Cons:
It may be complex for beginners.
Pricing:
- Free trial available for 15 days.
- It starts from $0.08 per hour.
Datadog
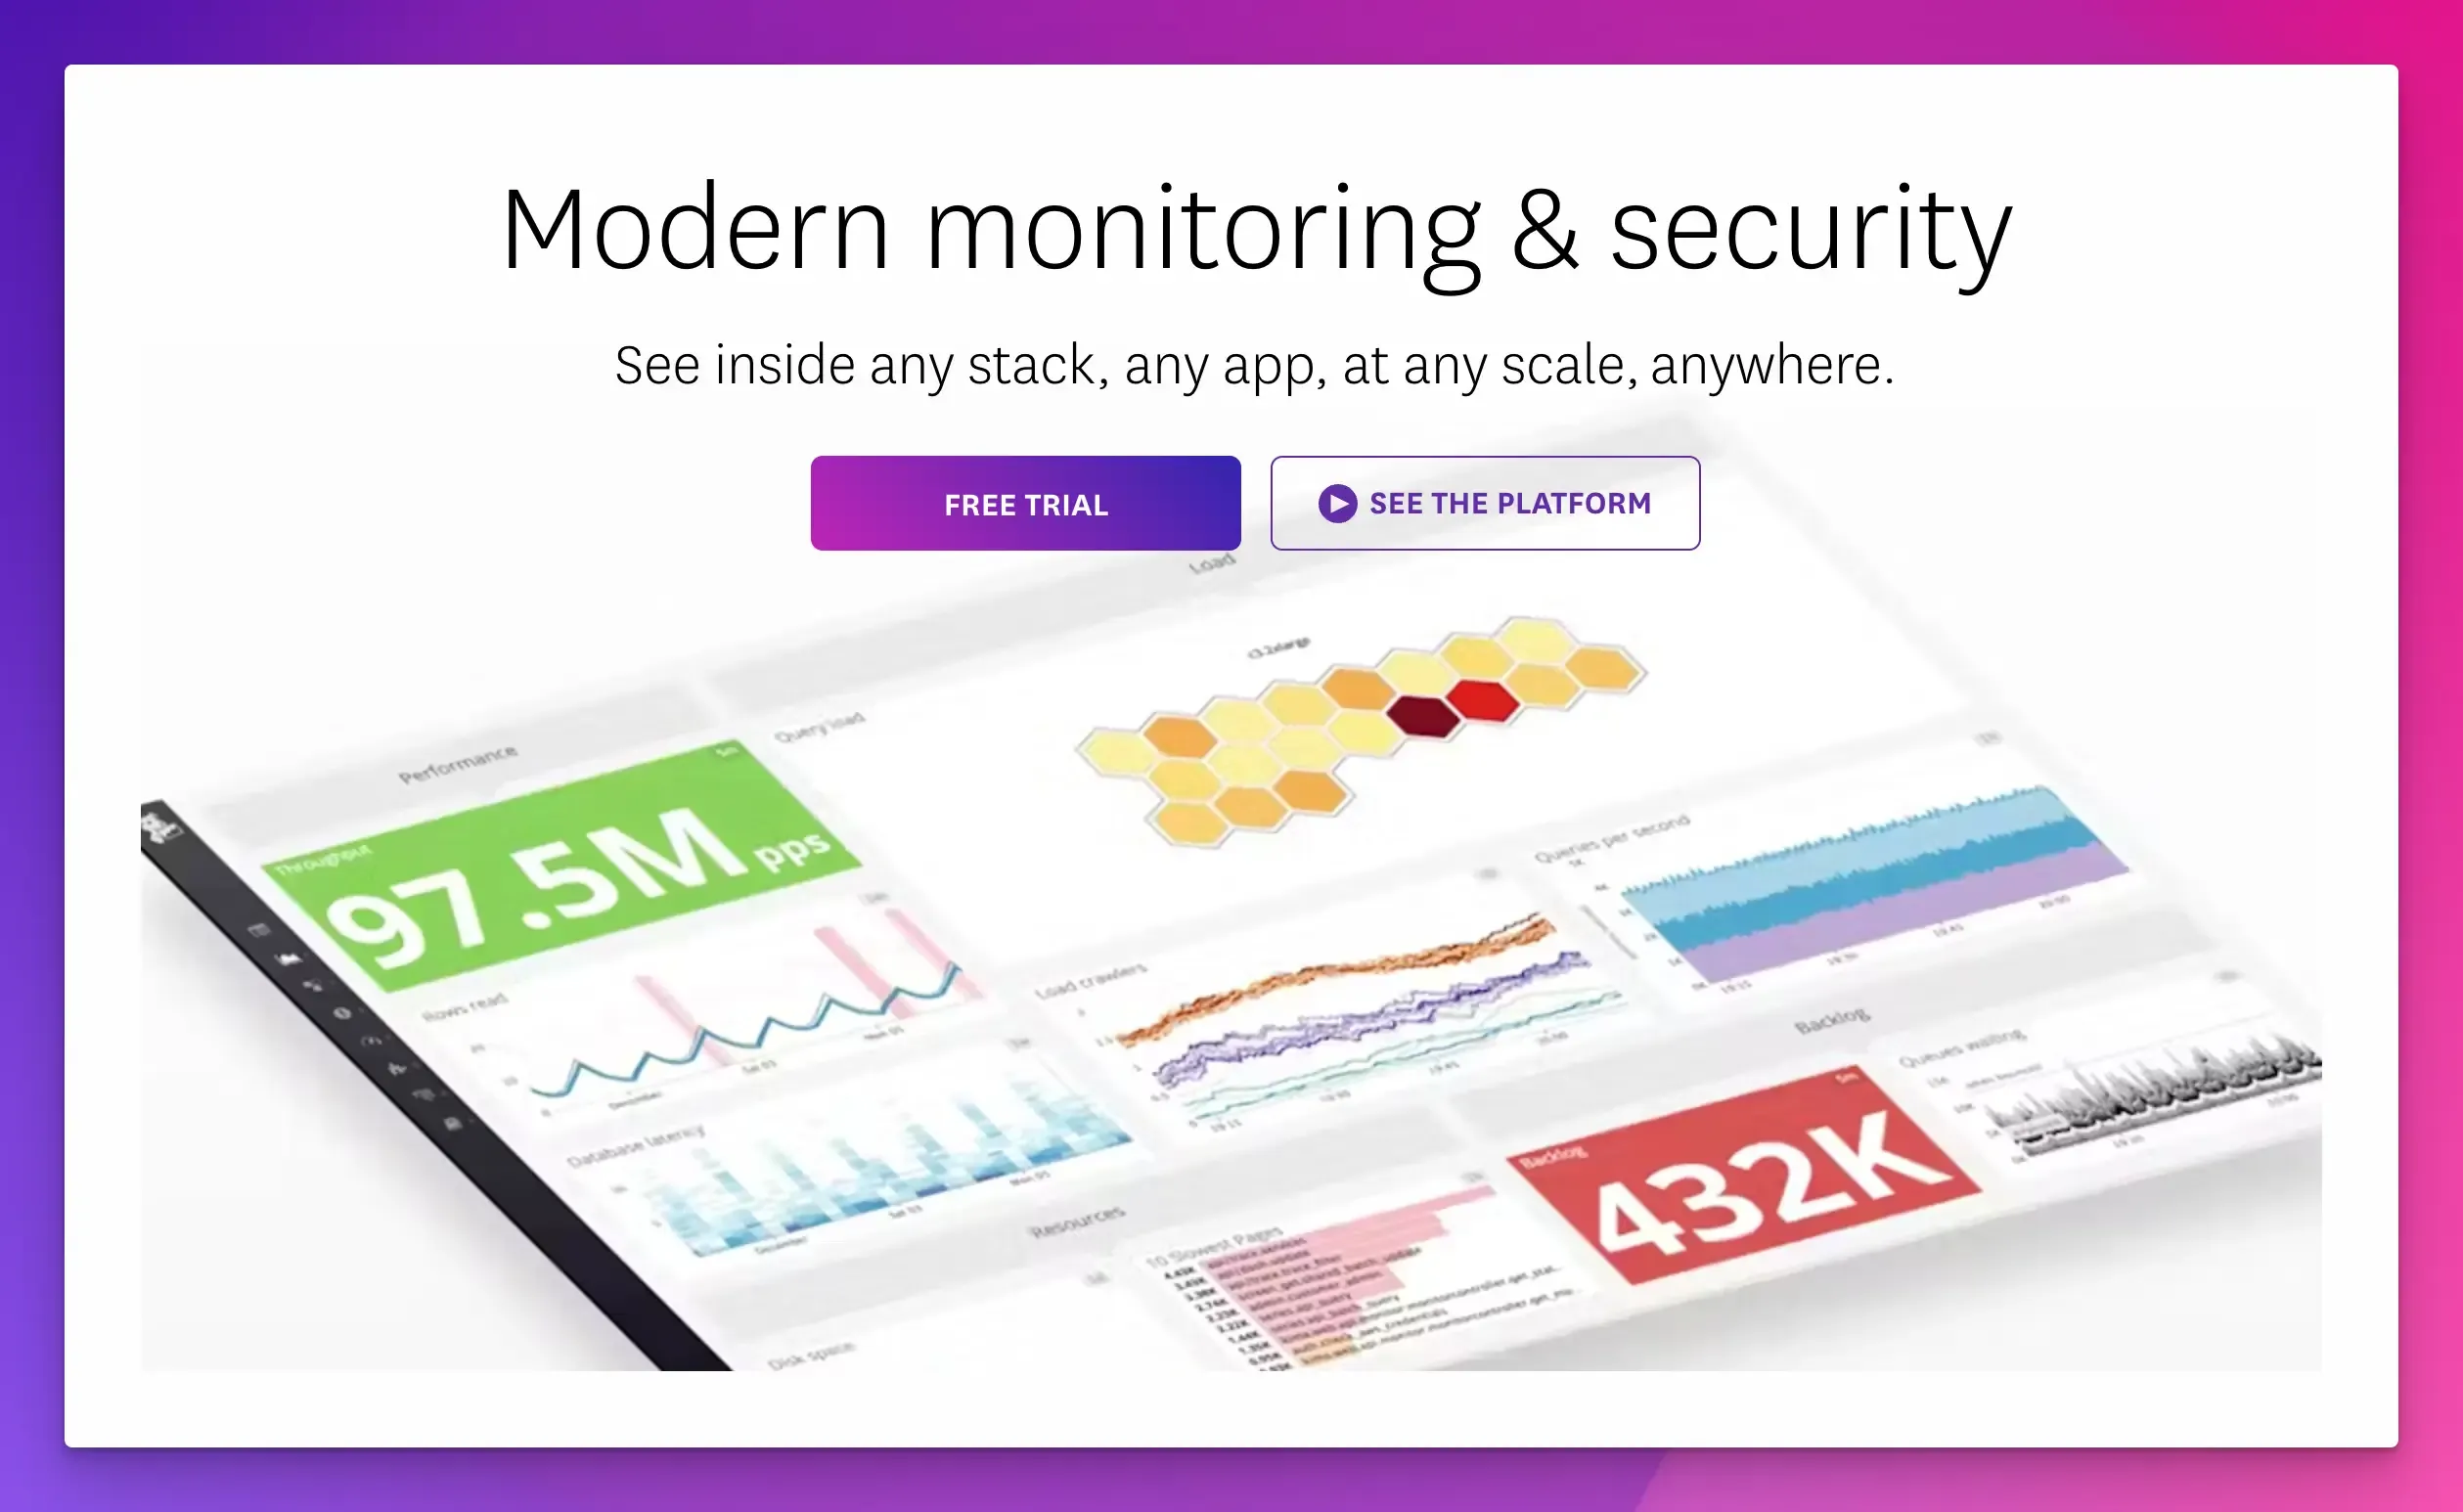
Datadog is a modern monitoring and security platform designed for cloud-scale applications.
It provides an all-in-one solution to monitor apps, infrastructure, networks, databases, serverless apps, and containers.
Key Features:
- Distributed tracing. It offers AI-powered code-level distributed tracing to view request flows across browsers, mobile apps, backend services, and databases.
- Interactive dashboards. You can get a unified view of logs, metrics, database queries, network performance, and real user monitoring (RUM) data. You can also share dashboards with your team for collaboration.
- Highly precise alerts. It uses machine learning to identify problems and provide actionable alerts, which helps minimize downtime and reduce false positives.
- Integrations. It offers over 700 integrations, including AWS, Azure, CircleCI, Docker, GitHub, Java, Jira, Kubernetes, and more.
Pros:
- Log management with audit trails and observability pipelines.
- Scalable for large, dynamic, and cloud-native environments.
Cons:
Steep learning curve and complex setup.
Pricing:
- Free trial available.
- It starts from $15 per host per month.
IBM Instana
IBM Instana is an automated application performance monitoring tool for full-stack observability.
It offers real-time visibility and AI-powered insights into the performance of browser and mobile apps, containers, databases, and user experiences.
Key Features:
- Automatic monitoring and discovery. One of its best features is it automatically detects and logs changes in large-scale applications and starts monitoring without manual configuration.
- Distributed tracing. It traces transactions across different components of an application and provides real-time alerts with insights into individual components performance and interaction.
- Automated root cause analysis. It automatically detects changes, issues, and incidents with data analytics and reporting features to track application performance.
Pros:
- Automatic incident management and issue resolution.
- Predictive alerting and recommendations.
Cons:
- Complex configuration.
- Pricing can be high for large-scale monitoring.
Pricing:
- Free trial available.
- It starts from $75 per host per month.
Sumo Logic
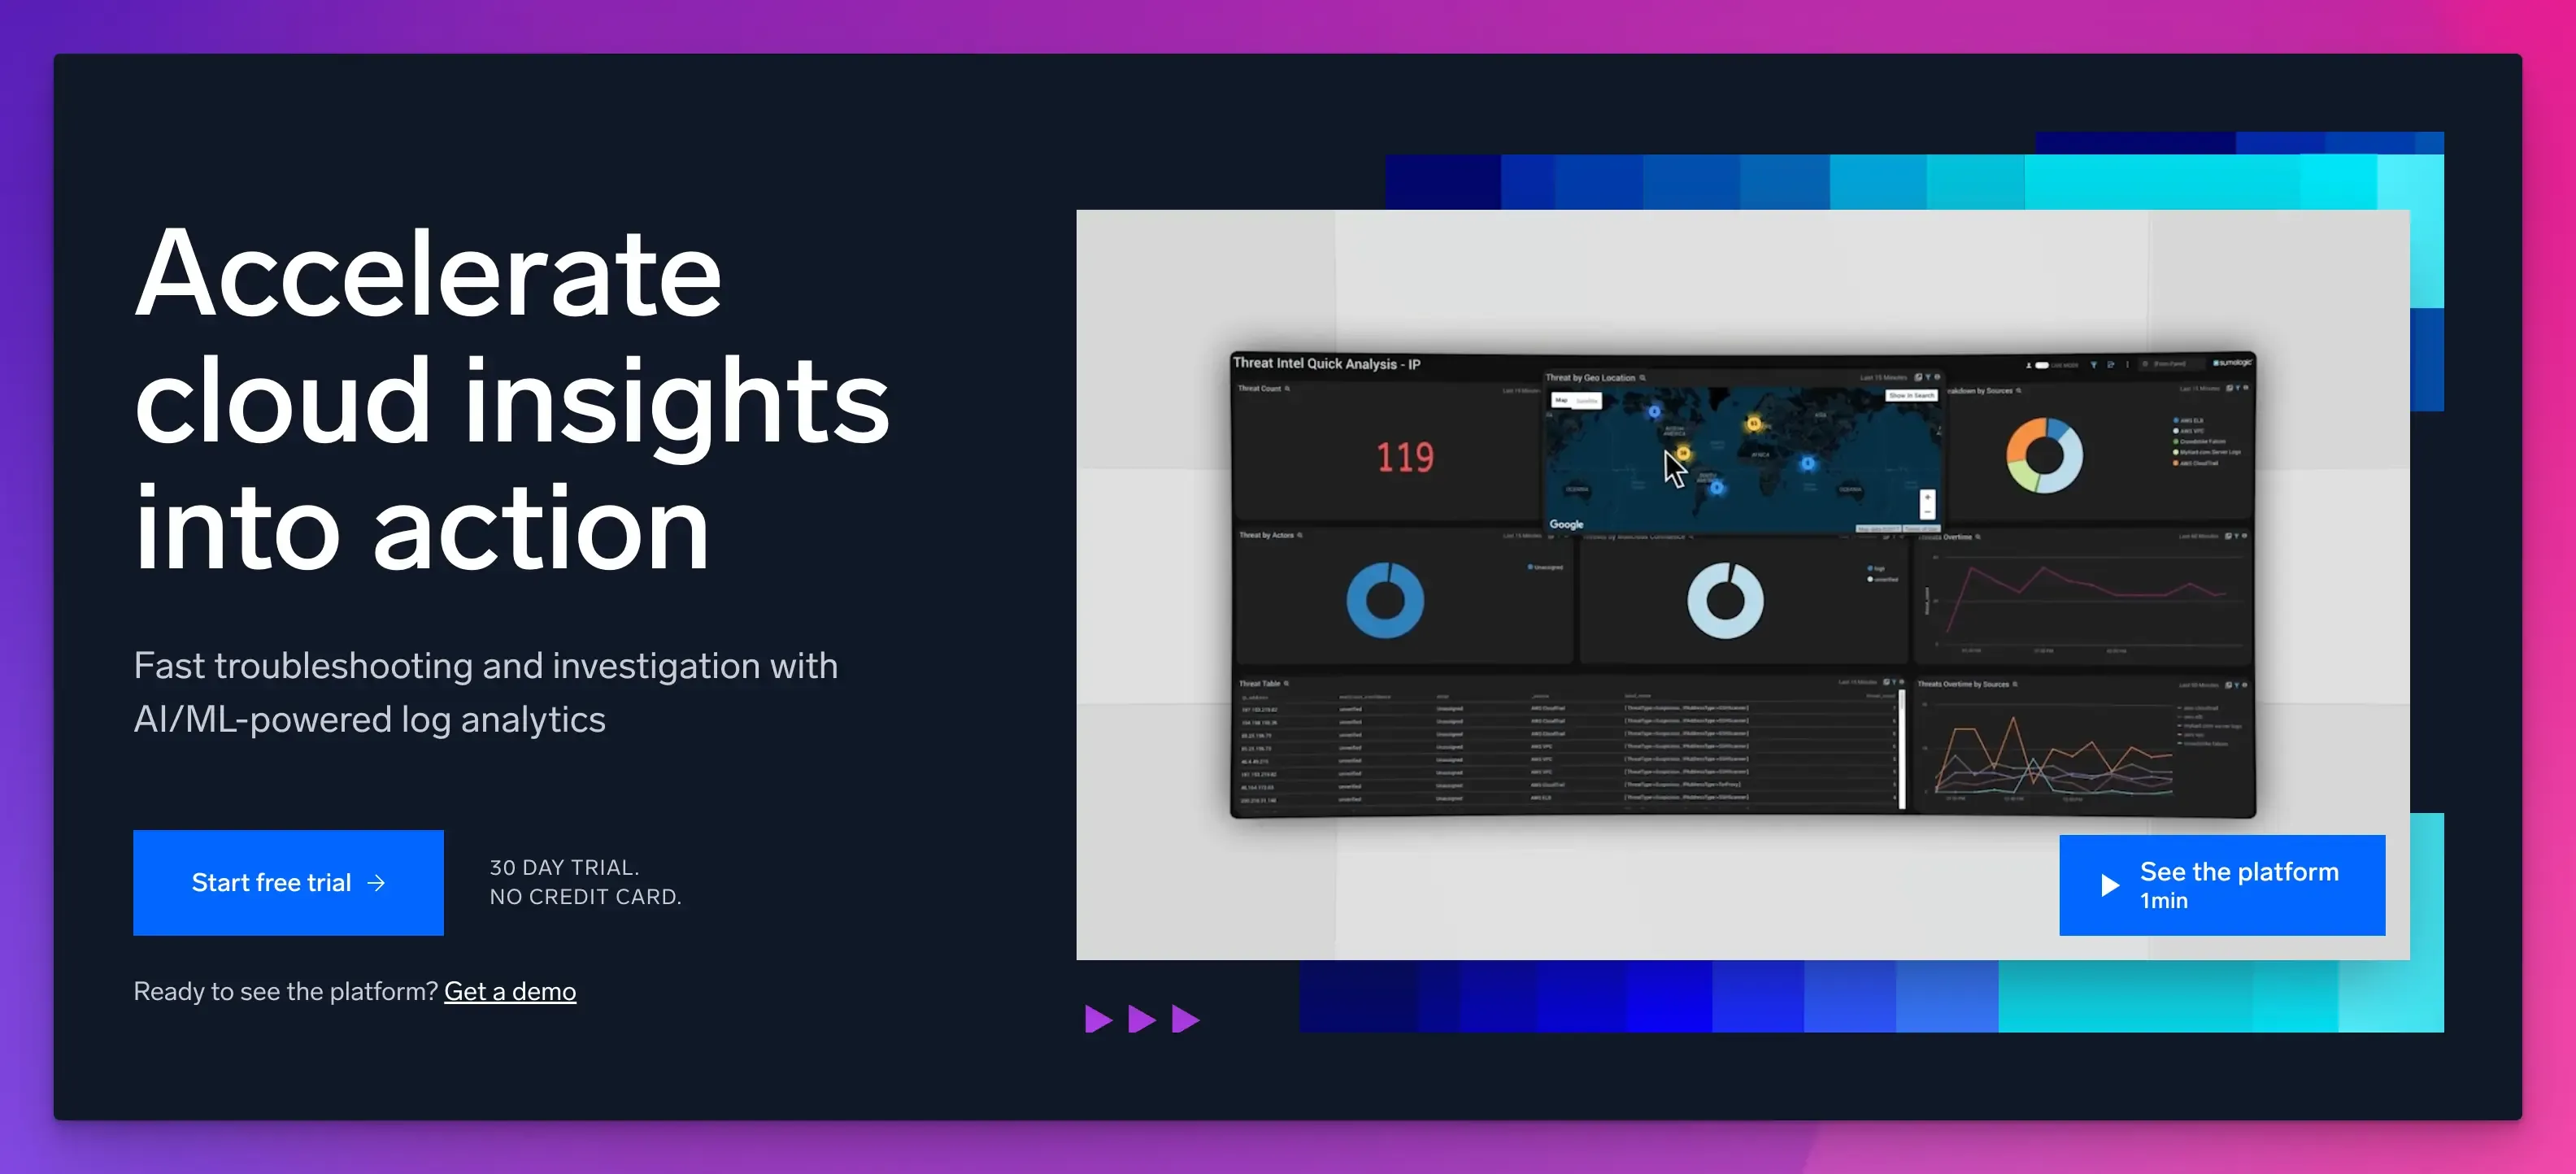
Sumo Logic is a cloud-native SaaS log analytics and integrated observability platform that provides continuous real-time intelligence across the application lifecycle.
Key Features:
- Unified application observability. It covers all your application data, including logs, events, metrics, and distributed tracing.
- Automatic discovery. It proactively discovers new apps, services, and infrastructure when deployed and provides automatically configured alerts.
- Dependencies visualization. You can visualize the service dependencies and track issues faster with customizable dashboards.
Pros:
- Comprehensive log management and advanced analytics.
- Real-time performance and security insights.
Cons:
The steep learning curve for new users.
Pricing:
- Free trial available.
- It costs $3.14 per TB scanned.
SolarWinds
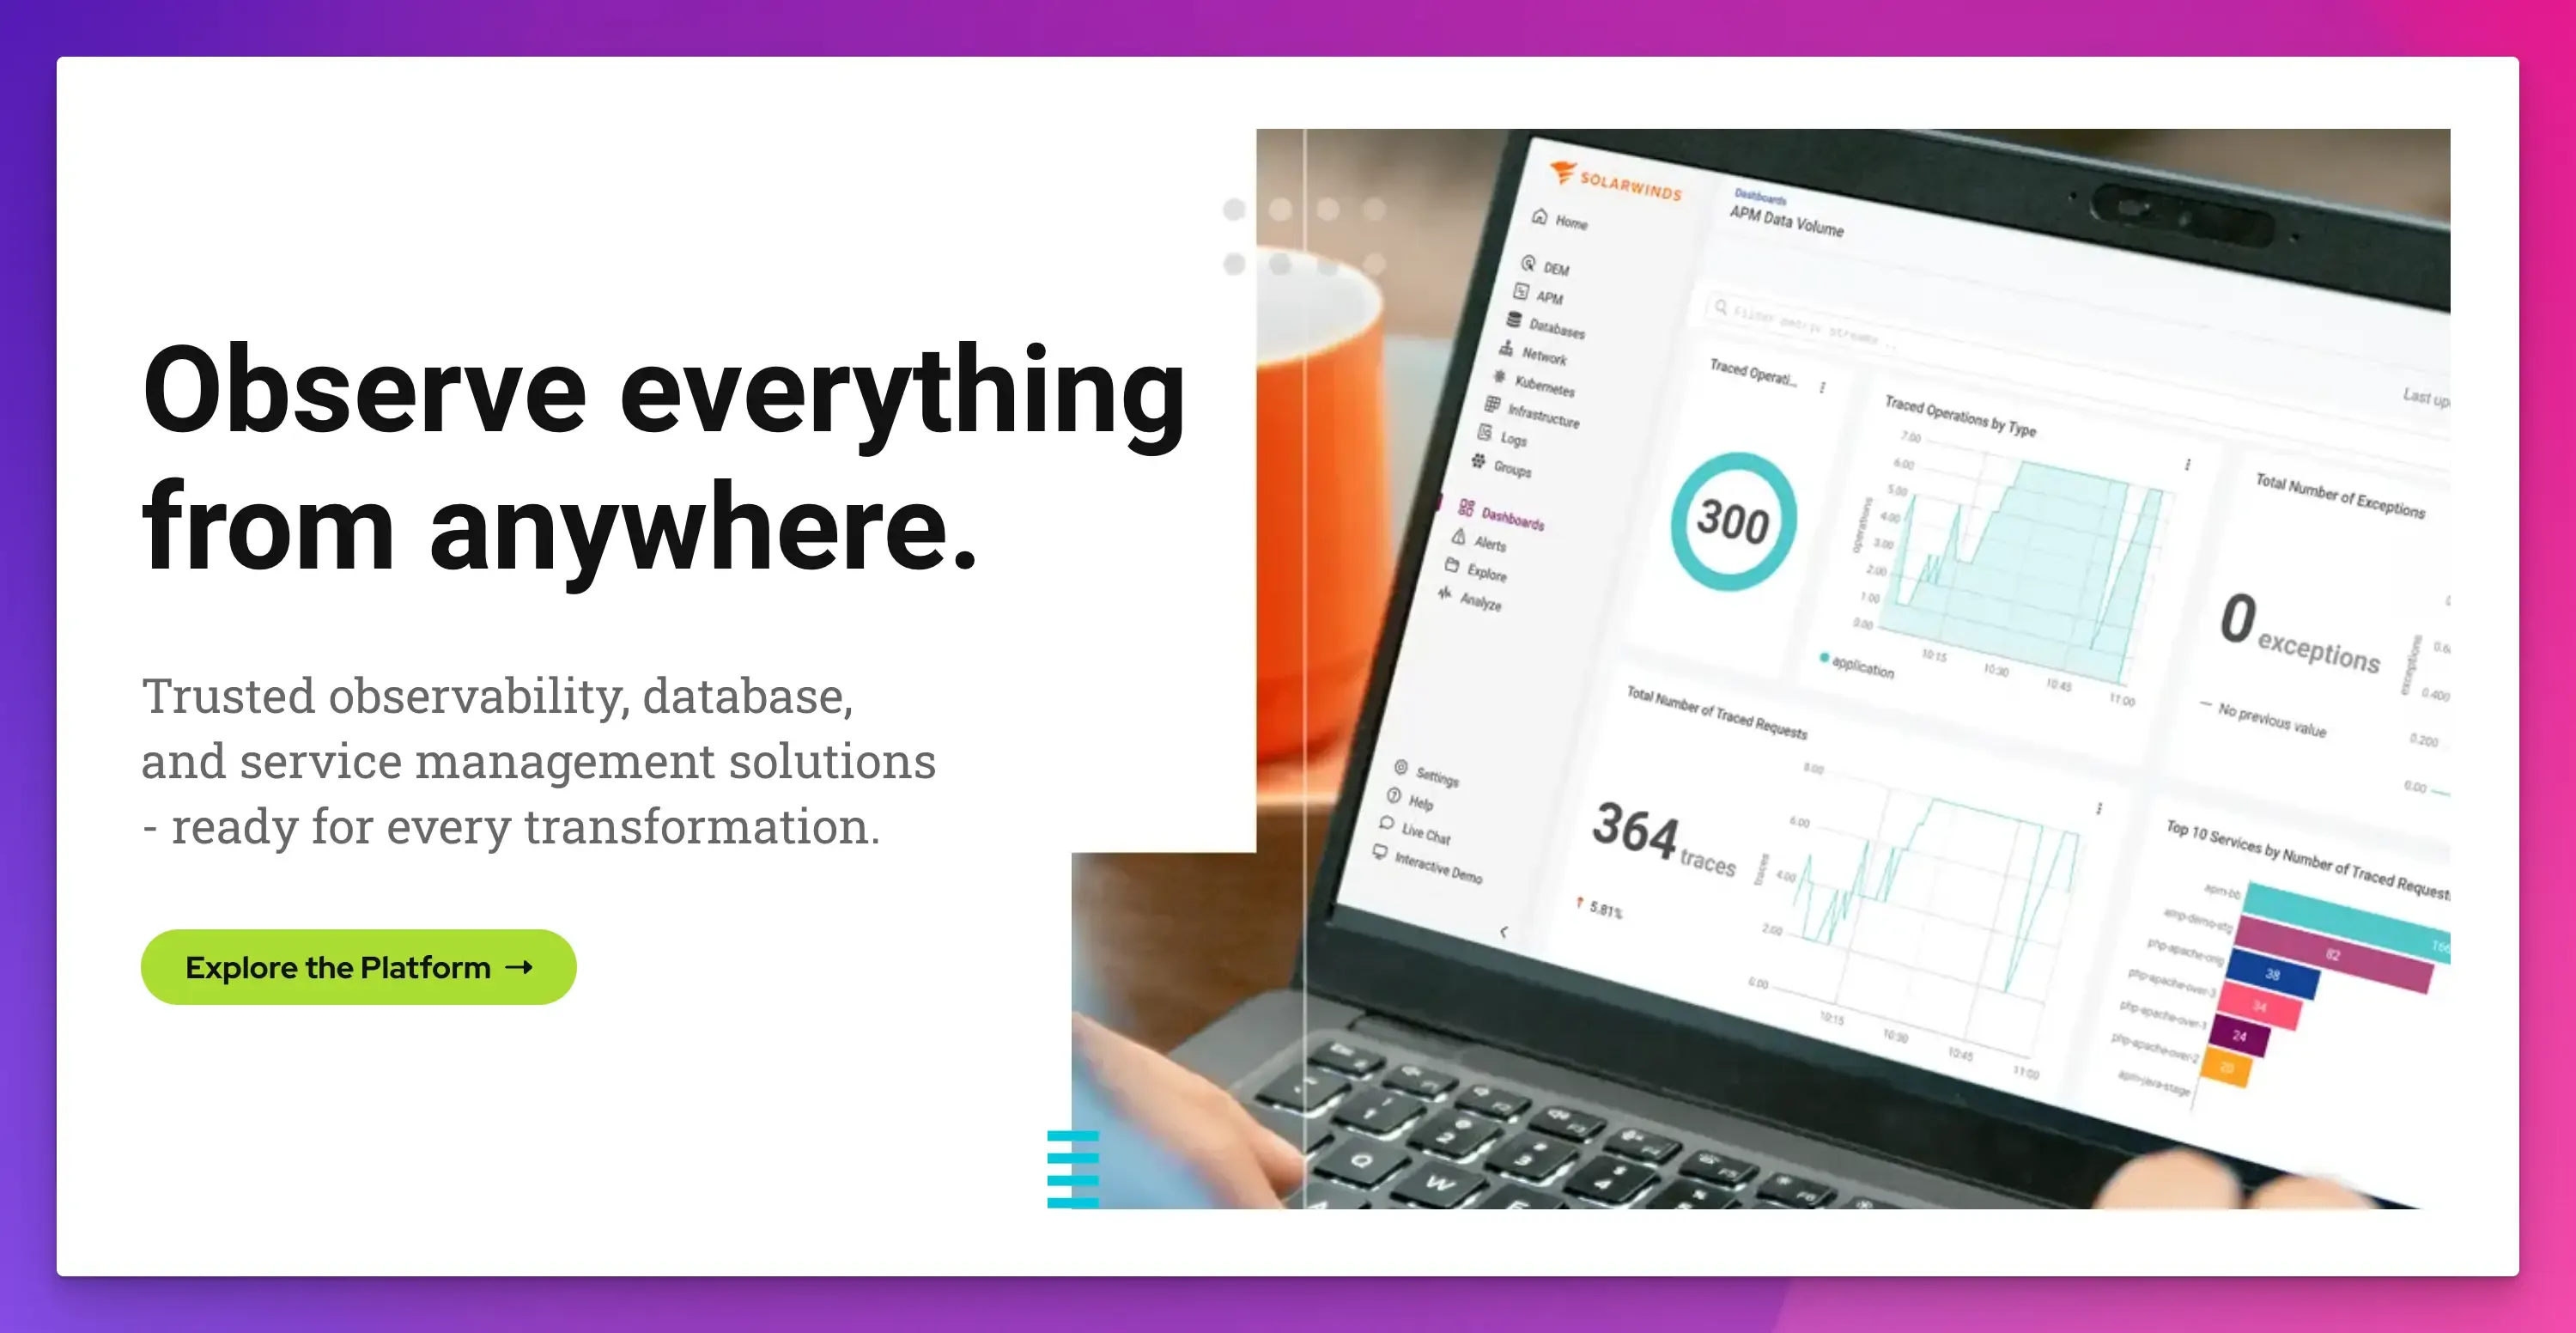
SolarWinds is a powerful monitoring, observability, and service management platform that provides a suite of products, including network and database management, server and application monitoring.
Key Features:
- Comprehensive monitoring. It provides code-level monitoring with distributed tracing, live code profiling, and exception tracking.
- Dashboards and visualization. A customizable dashboard that highlights performance metrics across the application stack provides end-to-end visibility to pinpoint the root cause quickly.
- Dependencies visualization. With the visualization map, see the dependencies across services and proactively monitor distributed applications to visualize which microservice or database is the root cause.
- Integrations. Pre-built integrations for third-party apps and frameworks.
Pros:
- Supports cloud-native, hybrid, and on-premises environments.
- Dependencies mapping and management.
Cons:
- Pricing can be high for large-scale projects.
- The installation process may be complicated.
Pricing:
- Free trial available.
- It starts from $24.99 for full-stack APM.
Splunk
Splunk is a unified security and observability platform widely used for log management, data analysis, and full-stack monitoring at scale.
Key Features:
- Distributed tracing. It detects errors from any change and offers quick visualization with distributed tracing to scope the severity of a problem and the key components affected.
- AI-powered insights. It uses machine learning to detect anomalies, predict trends, and automate root cause analysis with smart alerting.
- Code profiling. It provides continuous code profiling to analyze code-level performance and help troubleshoot bottlenecks and performance issues.
- Service maps. Get out-of-the-box visibility into all service interactions, microservices, dependencies, and performance.
Pros:
- End-to-end tracing across distributed services.
- Powerful data analysis and incident management.
Cons:
It may be complex for beginners.
Pricing:
14-day free trial available.
Other Application Performance Monitoring Tools You Can Explore
- Google Cloud Observability: APM for applications and systems running on Google Cloud, with integrated monitoring, logging, and tracing.
- LogRocket: For front-end performance monitoring with session replays and AI error tracking.
- Grafana: Open-source solution for data visualization, including metrics, logs, traces, and profiles.
- Site24x7: All-in-one monitoring solution for websites, servers, applications, networks, and user experiences.
- Raygun: For code-level diagnostics, server-side performance visibility, and real user monitoring.
- eG Innovations: IT infrastructure and end-to-end application performance monitoring with proactive alerts.
- LogicMonitor: SaaS-based automated monitoring and observability across hybrid and multi-cloud environments.
snappify will help you to create
stunning presentations and videos.
Final Words
We have carefully selected the best APM tools and platforms for your business and development needs.
Each tool offers a wide range of features, pricing options, and use cases, according to small businesses looking for an affordable solution and large enterprises requiring scalability.
Consider your requirements and evaluate the key features to choose the right tool for the smooth operation of your applications.
You can further explore our recent guides:
- 13 Best AI Platforms for Developers
- 15 Best Cloud Service Providers
- 8 Best Code Sharing Tools for Developers
FAQs:
How do I choose a monitoring tool?
To choose a monitoring tool, consider factors such as scalability, ease of integration with your current infrastructure, the level of observability provided, and the specific metrics important to your operations.
What is the difference between application performance monitoring and infrastructure monitoring?
Application performance monitoring (APM) focuses on application performance and behavior, while infrastructure monitoring deals with the health and performance of the underlying technology stack supporting those applications.
How important is user experience tracking in an APM tool?
User experience tracking is critical in an APM tool as it provides valuable insights into how end-users interact with your applications. It helps you identify and resolve performance issues that may impact user satisfaction.